

Question: (d) How much of the variation in the sample values of weekly gross revenue does the model in part (c) explain? If required, round your
| (d) | How much of the variation in the sample values of weekly gross revenue does the model in part (c) explain? |
| If required, round your answer to two decimal places. | |
| % | |
| (e) | Given the results in part (a) and part (c), what should your next step be? Explain. |
| The input in the box below will not be graded, but may be reviewed and considered by your instructor. |
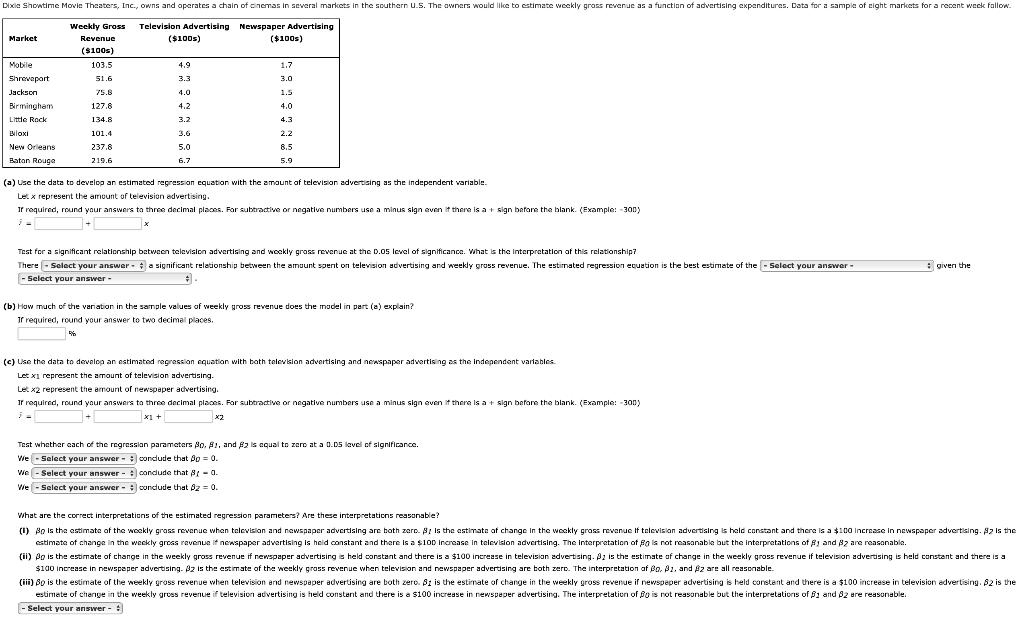
(a) Use the data to devalop an estimated regrassion equation with the amaunt of television advertising as the indepandent variabin. Let x represent the amount of television edvertising. If required, round your answors to three decimal places. Far subtractive or nogative numbers use a minus sign even if there is a + sign bofore the blank. Example: -300) j= Test for a significant relationship batweon telavisicn advertising and woekly gross revenue at the D.os level of significance. What is the interpretation af this relationship? Thin ant relationship between the amuunt spent on television advertising and weeky gross revenue. The estimated regression ecuation is the best estimate of the given the - Select vour answe (b) How much of the variation in the sample values of weekly gross revenue does the model in part (a) explain? Ir required, round your answer to two decimal places. (c) Use the data to devalop an ostimated regression cquation with both televilion advortising and newspoper adwortising as the independent varishies. Let x1 represent the amount of television advertising. Let x2 represent the amount of newspaper advertising. If required, round your answors to three decimal places. Far subtractive or negative numbers use a minus sign even if there is a + sign before the blank. (Example: -300) j=x1+x2 Teat whathar each of the regressian parameters 0,2, and 2 ls equal to zero at a a.D5 level of aignificanoe. WeWeWecondudethat0=0.condudethati=0.|condudethat2=0. What are the correct interpretations of the estimated regression parameters? Are these interpretations reasunable
Step by Step Solution
There are 3 Steps involved in it

Get step-by-step solutions from verified subject matter experts