

Question: d. In the Math 110 Estrada FA22 data folder, load the data set University Student Data. Create a histogram to describe the distribution of
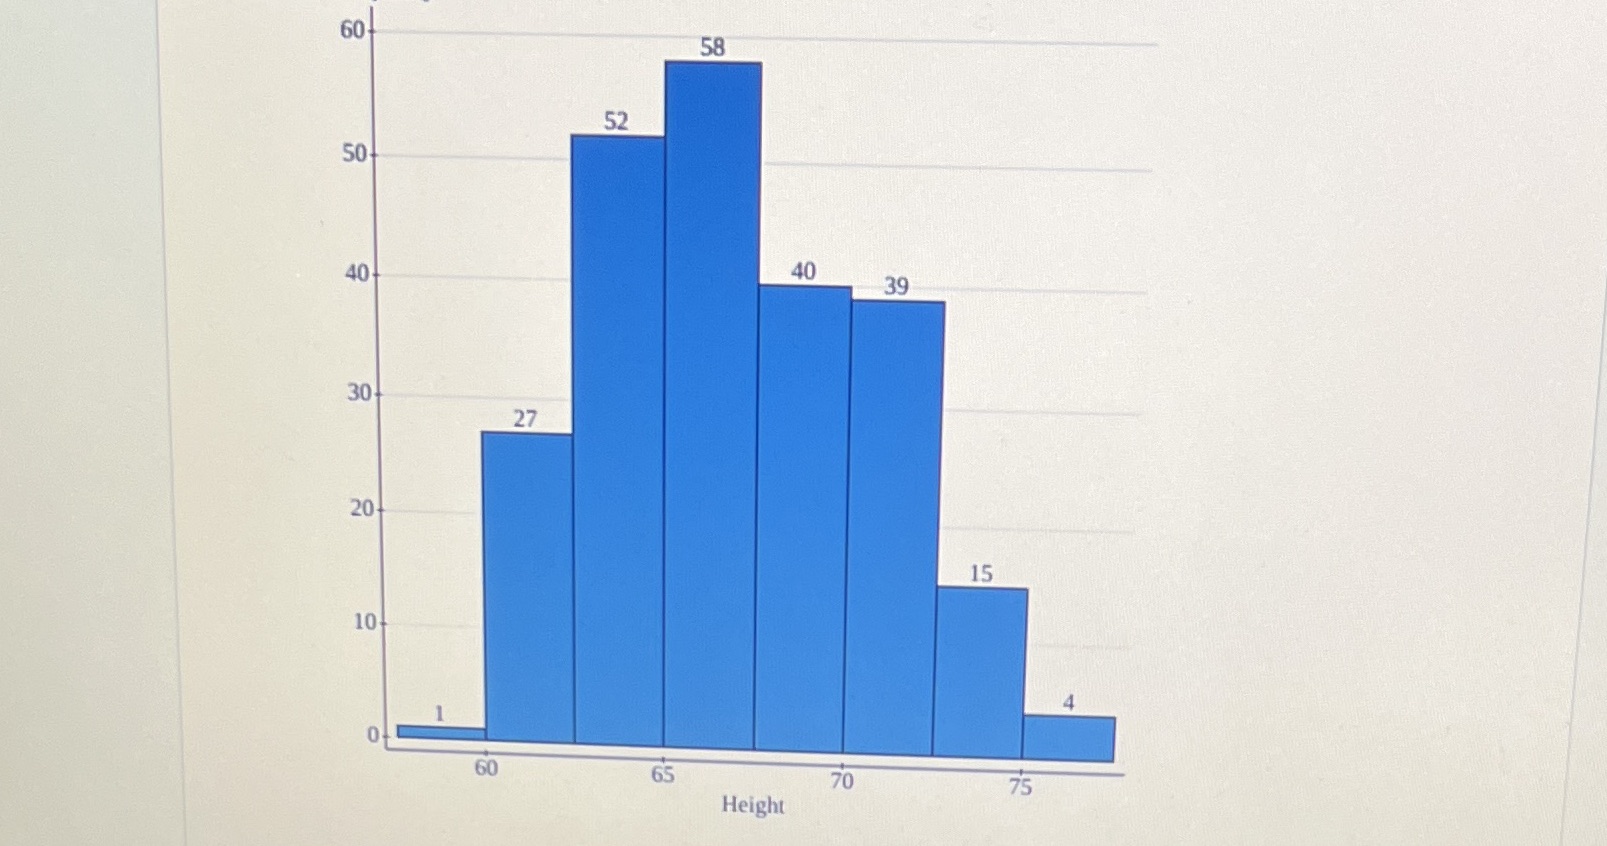
d. In the Math 110 Estrada FA22 data folder, load the data set University Student Data. Create a histogram to describe the distribution of the variable Height. (Hint: When describing the distribution use course vocabulary such as shape, outliers, center and spread. Be sure to write in complete sentences with associated units) 50 60 52 25 50 40 59 58 30 27 20 10 0 60 100 40 39 Height 70 15
Step by Step Solution
There are 3 Steps involved in it
1 Expert Approved Answer
Step: 1 Unlock

Question Has Been Solved by an Expert!
Get step-by-step solutions from verified subject matter experts
Step: 2 Unlock
Step: 3 Unlock