

Question: d. Plot the Security Market Line. Choose the correct graph. 113:00 45 40 15 10 0.55 0.5 1 1.5 2 2.5 3 3.5 4 Bt
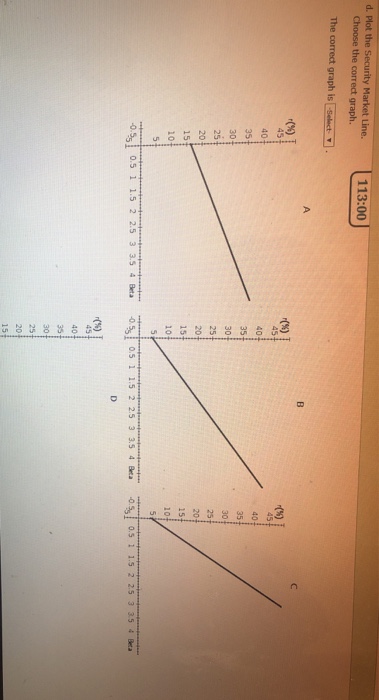
d. Plot the Security Market Line. Choose the correct graph. 113:00 45 40 15 10 0.55 0.5 1 1.5 2 2.5 3 3.5 4 Bt 50.5 1 1.5 2 25 3 35 4 a Ss 0.5 1 1.5 2 25 3 354Bea 0 40
Step by Step Solution
There are 3 Steps involved in it
1 Expert Approved Answer
Step: 1 Unlock

Question Has Been Solved by an Expert!
Get step-by-step solutions from verified subject matter experts
Step: 2 Unlock
Step: 3 Unlock