

Question: a. Use a spreadsheet (or a calculator with a linear regression function) to determine Stock X's beta coefficient. Do not round intermediate calculations. Round your
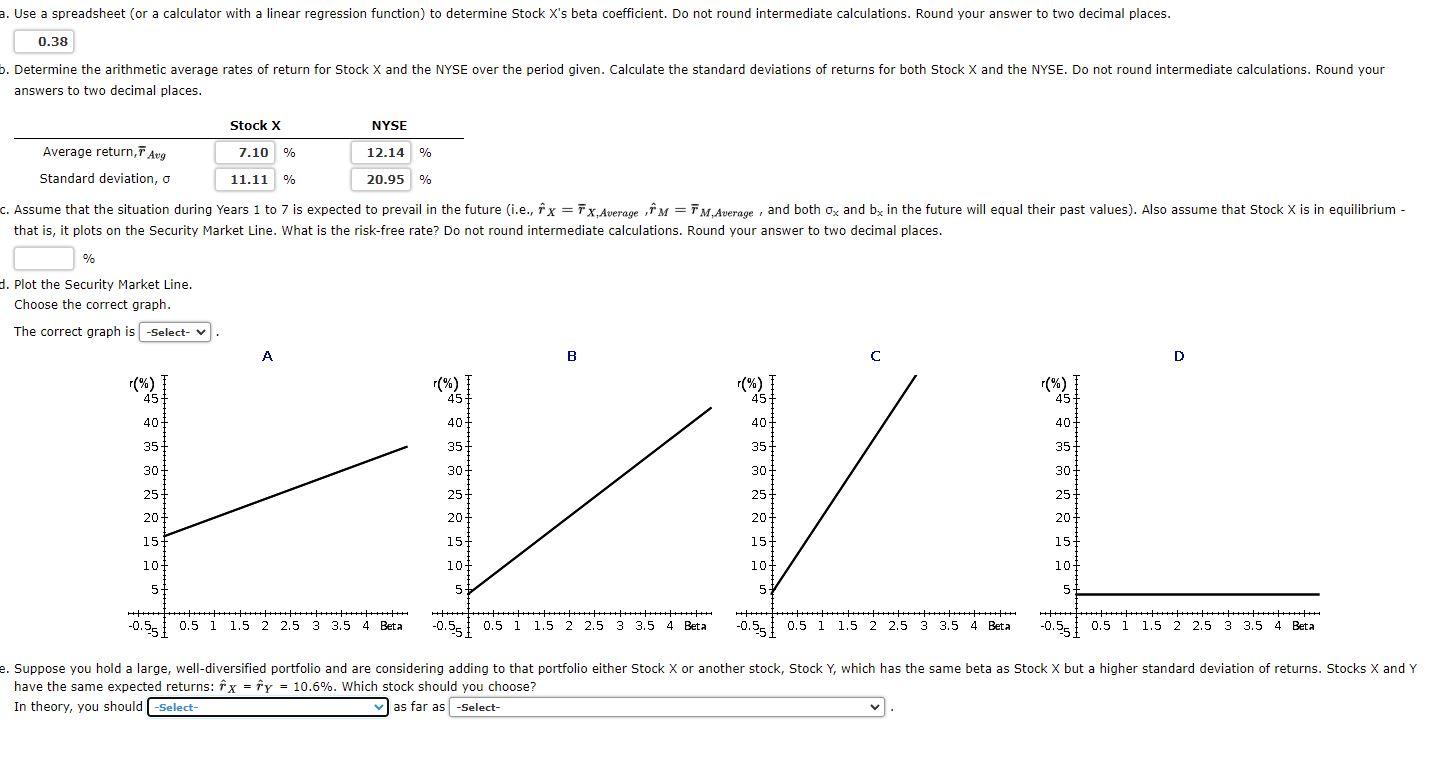
a. Use a spreadsheet (or a calculator with a linear regression function) to determine Stock X's beta coefficient. Do not round intermediate calculations. Round your answer to two decimal places. 0.38 b. Determine the arithmetic average rates of return for Stock X and the NYSE over the period given. Calculate the standard deviations of returns for both Stock X and the NYSE. Do not round intermediate calculations. Round your answers to two decimal places. Stock X NYSE 7.10 % 12.14 % Average return, Aug Standard deviation, o 11.11 % 20.95 % c. Assume that the situation during Years 1 to 7 is expected to prevail in the future (i.e., x = 7 x Average f m = M,Average, and both ox and bx in the future will equal their past values). Also assume that Stock X is in equilibrium - that is, it plots on the Security Market Line. What is the risk-free rate? Do not round intermediate calculations. Round your answer to two decimal places. % 3. Plot the Security Market Line. Choose the correct graph. The correct graph is -Select- B D (%) T 45 40 | (%) 1 45+ (%) I 45 45 407 40 40 35 35 35 35 301 301 30 30 IN 25 25+ 25 20 25 201 20+ 20 15 10 15 15 15 101 107 101 5 5 5 5 -0.55 0.5 1 1.5 2 2.5 3 3.5 4 Beta -0.55 10.5 1 1.5 2 2.5 3 3.5 4 Beta -0.55 0.5 1 1.5 2 2.5 3 3.5 4 Beta -0.55 10.5 1 1.5 2 2.5 3 3.5 4 Beta e. Suppose you hold a large, well-diversified portfolio and are considering adding to that portfolio either Stock X or another stock, Stock Y, which has the same beta as Stock X but a higher standard deviation of returns. Stocks X and Y have the same expected returns: fx = fy = 10.6%. Which stock should you choose? In theory, you should -Select- as far as -Select- a. Use a spreadsheet (or a calculator with a linear regression function) to determine Stock X's beta coefficient. Do not round intermediate calculations. Round your answer to two decimal places. 0.38 b. Determine the arithmetic average rates of return for Stock X and the NYSE over the period given. Calculate the standard deviations of returns for both Stock X and the NYSE. Do not round intermediate calculations. Round your answers to two decimal places. Stock X NYSE 7.10 % 12.14 % Average return, Aug Standard deviation, o 11.11 % 20.95 % c. Assume that the situation during Years 1 to 7 is expected to prevail in the future (i.e., x = 7 x Average f m = M,Average, and both ox and bx in the future will equal their past values). Also assume that Stock X is in equilibrium - that is, it plots on the Security Market Line. What is the risk-free rate? Do not round intermediate calculations. Round your answer to two decimal places. % 3. Plot the Security Market Line. Choose the correct graph. The correct graph is -Select- B D (%) T 45 40 | (%) 1 45+ (%) I 45 45 407 40 40 35 35 35 35 301 301 30 30 IN 25 25+ 25 20 25 201 20+ 20 15 10 15 15 15 101 107 101 5 5 5 5 -0.55 0.5 1 1.5 2 2.5 3 3.5 4 Beta -0.55 10.5 1 1.5 2 2.5 3 3.5 4 Beta -0.55 0.5 1 1.5 2 2.5 3 3.5 4 Beta -0.55 10.5 1 1.5 2 2.5 3 3.5 4 Beta e. Suppose you hold a large, well-diversified portfolio and are considering adding to that portfolio either Stock X or another stock, Stock Y, which has the same beta as Stock X but a higher standard deviation of returns. Stocks X and Y have the same expected returns: fx = fy = 10.6%. Which stock should you choose? In theory, you should -Select- as far as -Select
Step by Step Solution
There are 3 Steps involved in it

Get step-by-step solutions from verified subject matter experts