

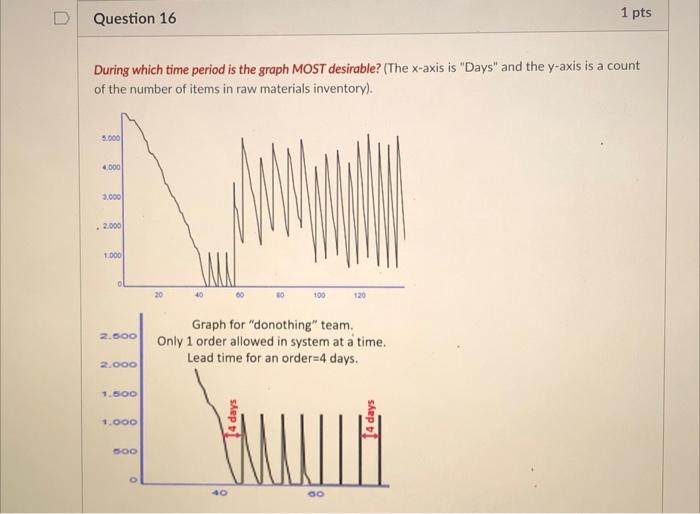
Question: D Question 16 1 pts During which time period is the graph MOST desirable? (The x-axis is Days and the y-axis is a count of
Step by Step Solution
There are 3 Steps involved in it
1 Expert Approved Answer
Step: 1 Unlock

Question Has Been Solved by an Expert!
Get step-by-step solutions from verified subject matter experts
Step: 2 Unlock
Step: 3 Unlock