Question: For questions 4 through 7, use the graph below, and assume the following: The three processes below follow Gaussian/Normal distribution The outcomes in the x-axis
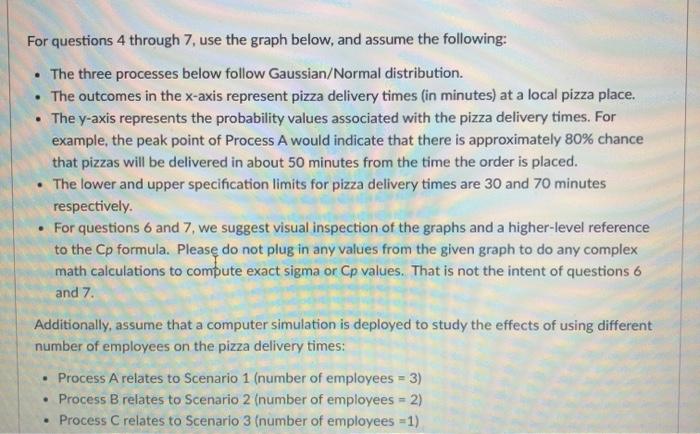
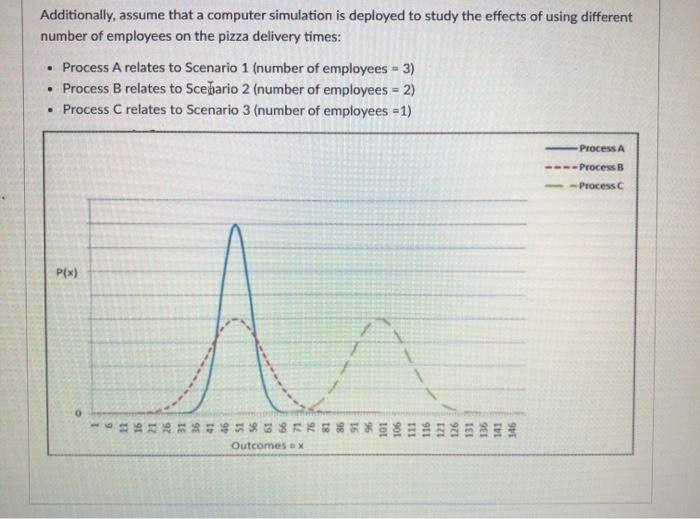
For questions 4 through 7, use the graph below, and assume the following: The three processes below follow Gaussian/Normal distribution The outcomes in the x-axis represent pizza delivery times in minutes) at a local pizza place. The y-axis represents the probability values associated with the pizza delivery times. For example, the peak point of Process A would indicate that there is approximately 80% chance that pizzas will be delivered in about 50 minutes from the time the order is placed. The lower and upper specification limits for pizza delivery times are 30 and 70 minutes respectively. . For questions 6 and 7, we suggest visual inspection of the graphs and a higher-level reference to the Cp formula. Please do not plug in any values from the given graph to do any complex math calculations to compute exact sigma or Cp values. That is not the intent of questions 6 and 7 Additionally, assume that a computer simulation is deployed to study the effects of using different number of employees on the pizza delivery times: Process A relates to Scenario 1 (number of employees = 3) Process Brelates to Scenario 2 (number of employees =2) Process Crelates to Scenario 3 (number of employees =1) Additionally, assume that a computer simulation is deployed to study the effects of using different number of employees on the pizza delivery times: Process A relates to Scenario 1 (number of employees - 3) Process B relates to Scehario 2 (number of employees = 2) Process Crelates to Scenario 3 (number of employees = 1) Process A ----Process B --Process P(x) 0 -99938258 101 106 Outcomes ex Question 4 1 pts With reference to inspecting if pizza delivery times are within an acceptable range specified by customers, Scenario 1 is expected to have a lower appraisal cost than Scenario 2. True False Question 5 1 pts With reference to pizza delivery times, since the controllimits are: within (le., Inside the range of) spec, limits in Scenario 1, and outside spec. limits in Scenario 2, we would expect a good quality engineer to rate Scenario 1 to be better than Scenario 2. True False D Question 6 1 pts Identify the true statement. O a Processes associated with Scenario 1 and 2 seem to have similar variation and hence, similar sigma (a) values. b. Processes associated with Scenario 1 and 3 seem to have similar variation and hence, similar sigma (a) values c. Processes associated with Scenario 2 and 3 seem to have similar variation and hence, similar sigma (a) values O d. Choices a and b are both true Question 7 1 pts Identify the true statement. a. Processes associated with Scenario 1 and 2 are likely to have similar Cp values b. Processes associated with Scenario 1 and 3 are likely to have similar Cp values. c. Processes associated with Scenario 2 and 3 are likely to have similar Cp values. For questions 4 through 7, use the graph below, and assume the following: The three processes below follow Gaussian/Normal distribution The outcomes in the x-axis represent pizza delivery times in minutes) at a local pizza place. The y-axis represents the probability values associated with the pizza delivery times. For example, the peak point of Process A would indicate that there is approximately 80% chance that pizzas will be delivered in about 50 minutes from the time the order is placed. The lower and upper specification limits for pizza delivery times are 30 and 70 minutes respectively. . For questions 6 and 7, we suggest visual inspection of the graphs and a higher-level reference to the Cp formula. Please do not plug in any values from the given graph to do any complex math calculations to compute exact sigma or Cp values. That is not the intent of questions 6 and 7 Additionally, assume that a computer simulation is deployed to study the effects of using different number of employees on the pizza delivery times: Process A relates to Scenario 1 (number of employees = 3) Process Brelates to Scenario 2 (number of employees =2) Process Crelates to Scenario 3 (number of employees =1) Additionally, assume that a computer simulation is deployed to study the effects of using different number of employees on the pizza delivery times: Process A relates to Scenario 1 (number of employees - 3) Process B relates to Scehario 2 (number of employees = 2) Process Crelates to Scenario 3 (number of employees = 1) Process A ----Process B --Process P(x) 0 -99938258 101 106 Outcomes ex Question 4 1 pts With reference to inspecting if pizza delivery times are within an acceptable range specified by customers, Scenario 1 is expected to have a lower appraisal cost than Scenario 2. True False Question 5 1 pts With reference to pizza delivery times, since the controllimits are: within (le., Inside the range of) spec, limits in Scenario 1, and outside spec. limits in Scenario 2, we would expect a good quality engineer to rate Scenario 1 to be better than Scenario 2. True False D Question 6 1 pts Identify the true statement. O a Processes associated with Scenario 1 and 2 seem to have similar variation and hence, similar sigma (a) values. b. Processes associated with Scenario 1 and 3 seem to have similar variation and hence, similar sigma (a) values c. Processes associated with Scenario 2 and 3 seem to have similar variation and hence, similar sigma (a) values O d. Choices a and b are both true Question 7 1 pts Identify the true statement. a. Processes associated with Scenario 1 and 2 are likely to have similar Cp values b. Processes associated with Scenario 1 and 3 are likely to have similar Cp values. c. Processes associated with Scenario 2 and 3 are likely to have similar Cp values