

Question: D Question 3 This question refers to the following graph, which shows average total cost, average variable cost and marginal cost curves for a perfectly
D Question 3 This question refers to the following graph, which shows average total cost, average variable cost and marginal cost curves for a perfectly competitive firm in the short run: Cost curves $250- 200--- 150 100- $0 Point B 0 Point A Point C 1 2 3 4 5 Curve 1 6 7 8 9 10 11 Quantity of output (per day) The shut-down price for this firm is about O $170 (at point B) $100 (at point A) $90 (at point C) Curve 2 Curve 3 0.5 pts
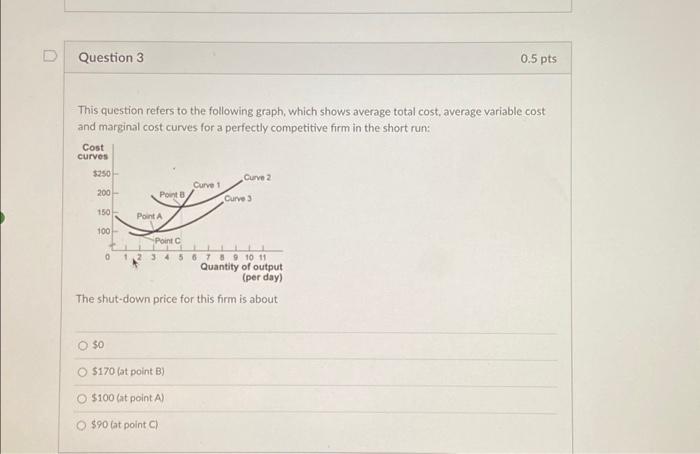
This question refers to the following graph, which shows average total cost, average variable cost and marginal cost curves for a perfectly competitive firm in the short run: The shut-down price for this firm is about 50 $170 (at point B) $100 (at point A) $90 tat point C)
Step by Step Solution
There are 3 Steps involved in it
1 Expert Approved Answer
Step: 1 Unlock

Question Has Been Solved by an Expert!
Get step-by-step solutions from verified subject matter experts
Step: 2 Unlock
Step: 3 Unlock