

Question: I have attached the graph and the questions. Please answer correctly. The following graph shows the average and marginal cost curves for Kandi Keynes, a
I have attached the graph and the questions. Please answer correctly.
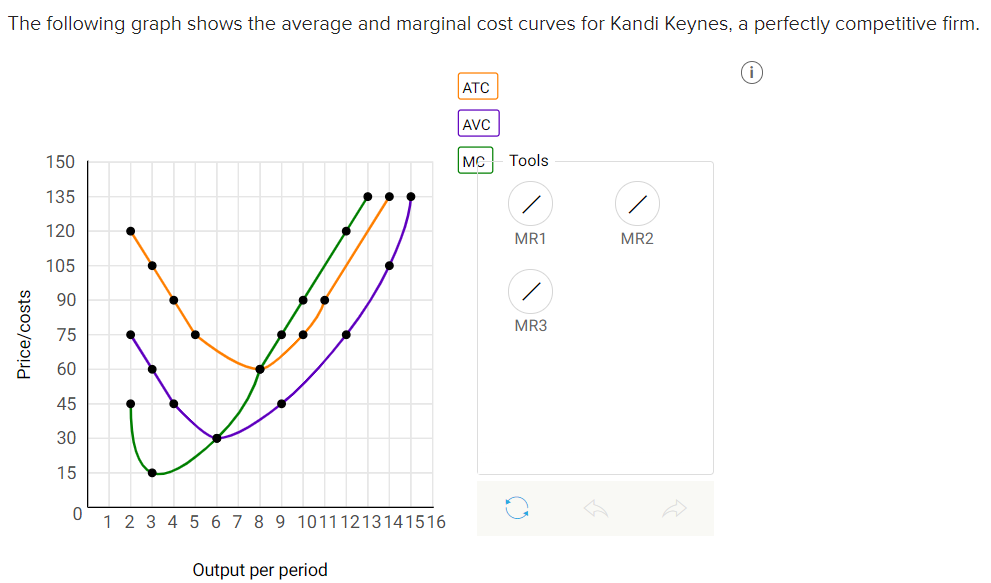

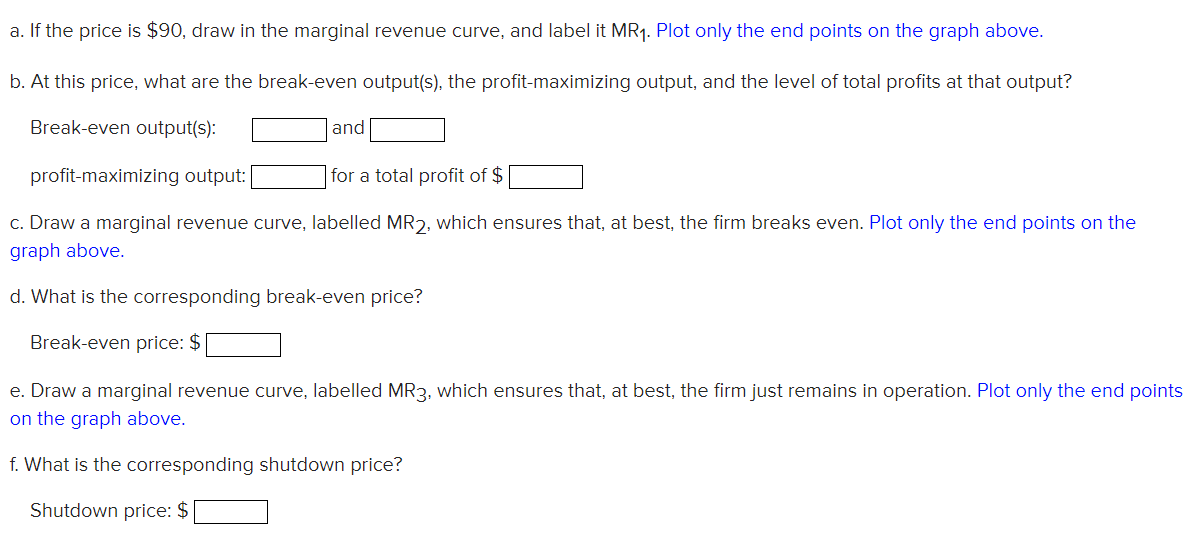
The following graph shows the average and marginal cost curves for Kandi Keynes, a perfectly competitive firm. ATC AVC 150 MC Tools 135 120 MR1 MR2 105 90 MR3 Price/costs 75 60 45 30 15 1 2 3 4 5 6 7 8 9 1011 1213 14 15 16 O Output per perioda. If the price is $90, draw in the marginal revenue curve, and label it MR1. Plot only the end points on the graph above. b. At this price, what are the breakeeven output(s). the protemaximizing output, and the level of total profits at that output? Breakeven output(s): and profitmaximizing output: for a total prot of $ c. Draw a marginal revenue curve, labelled MR2, which ensures that, at best, the rm breaks even. Plot only the end points on the graph above. d. What is the corresponding breakeven price? Breakseven price: $ e. Draw a marginal revenue curve, labelled MR3. which ensures that, at best, the firmjust remains in operation. Plot only the end points on the graph above. f. What is the corresponding shutdown price? Shutdown price: $
Step by Step Solution
There are 3 Steps involved in it

Get step-by-step solutions from verified subject matter experts