

Question: D Question 39 6 pts The dataset below is a fictitious sample from number of hours of exercise per week (x) and scores on a
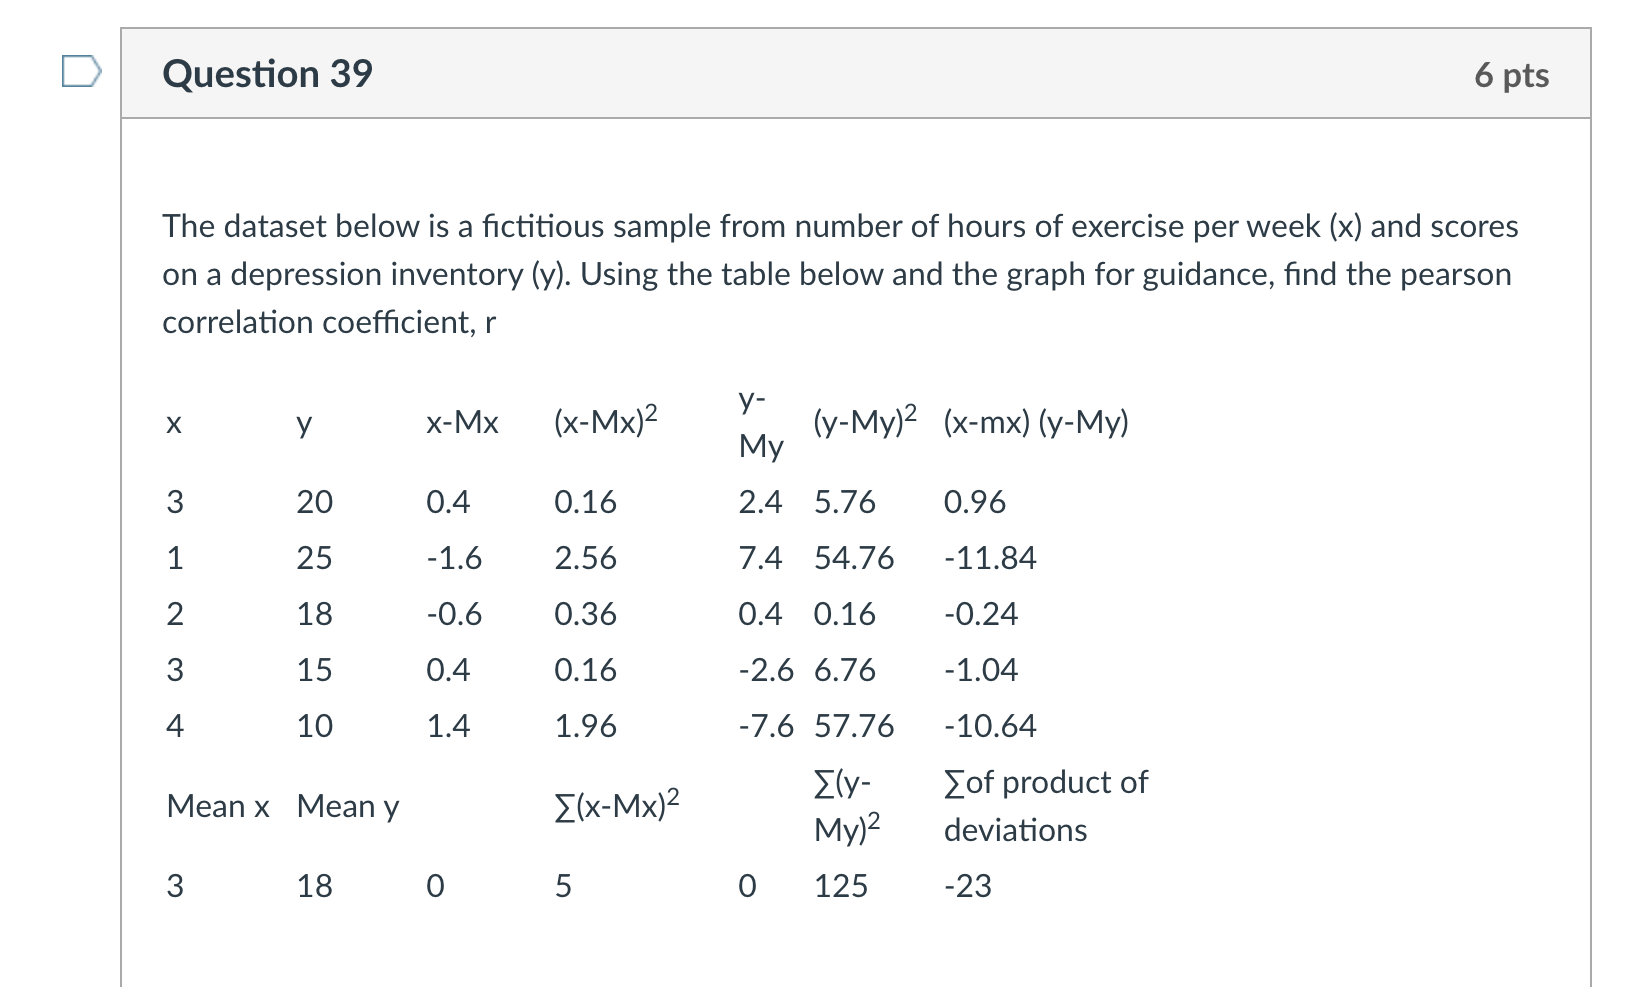
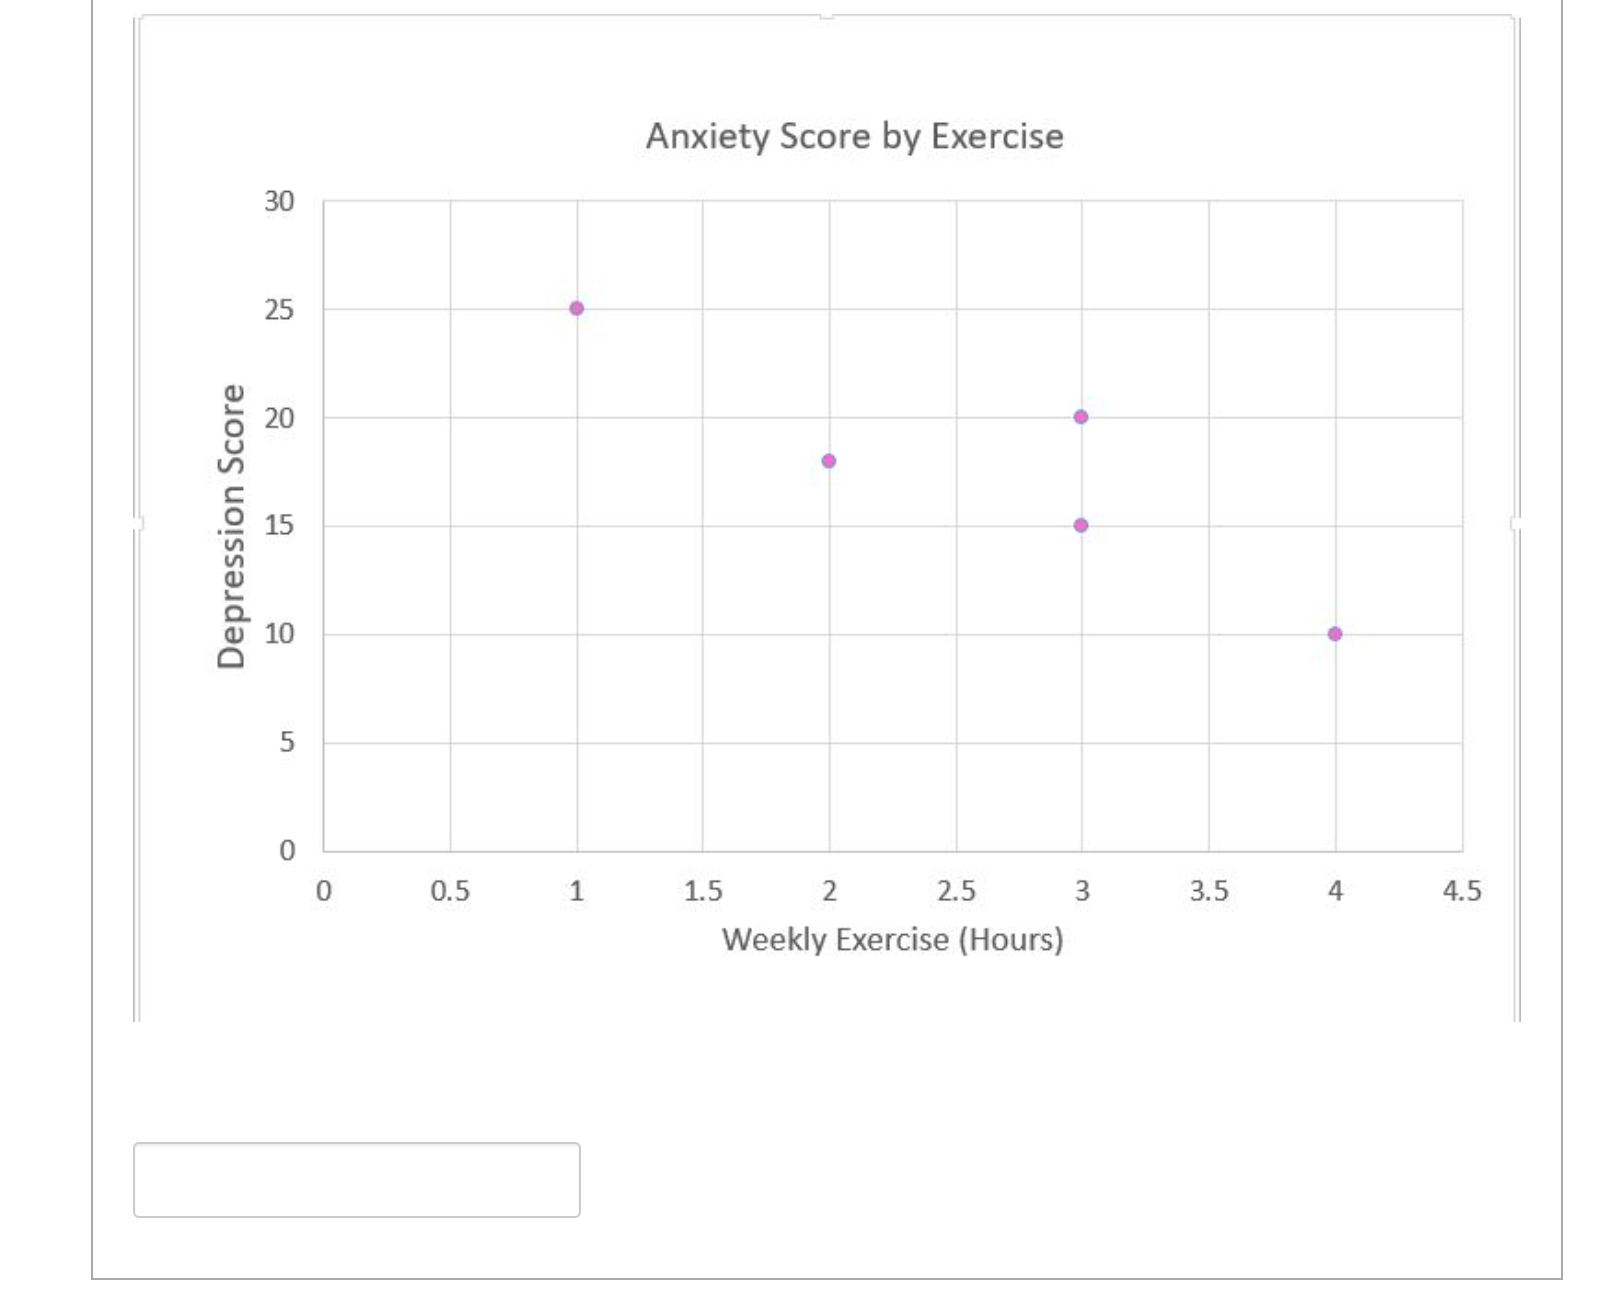
D Question 39 6 pts The dataset below is a fictitious sample from number of hours of exercise per week (x) and scores on a depression inventory (y). Using the table below and the graph for guidance, find the pearson correlation coefficient, r X y X-Mx (x-Mx) 2 y- My (y-My) 2 (x-mx) ( y-My) 3 20 0.4 0.16 2.4 5.76 0.96 25 -1.6 2.56 7.4 54.76 -11.84 2 18 -0.6 0.36 0.4 0.16 -0.24 3 15 0.4 0.16 -2.6 6.76 -1.04 4 10 1.4 1.96 -7.6 57.76 -10.64 Ely- Mean x Mean y [ ( x- Mx) 2 [of product of My) 2 deviations 3 18 0 5 125 -23\f
Step by Step Solution
There are 3 Steps involved in it
1 Expert Approved Answer
Step: 1 Unlock

Question Has Been Solved by an Expert!
Get step-by-step solutions from verified subject matter experts
Step: 2 Unlock
Step: 3 Unlock