

Question: d . Select the correct graph for NPV profiles for Plans A and B . A B C D The correct graph is (
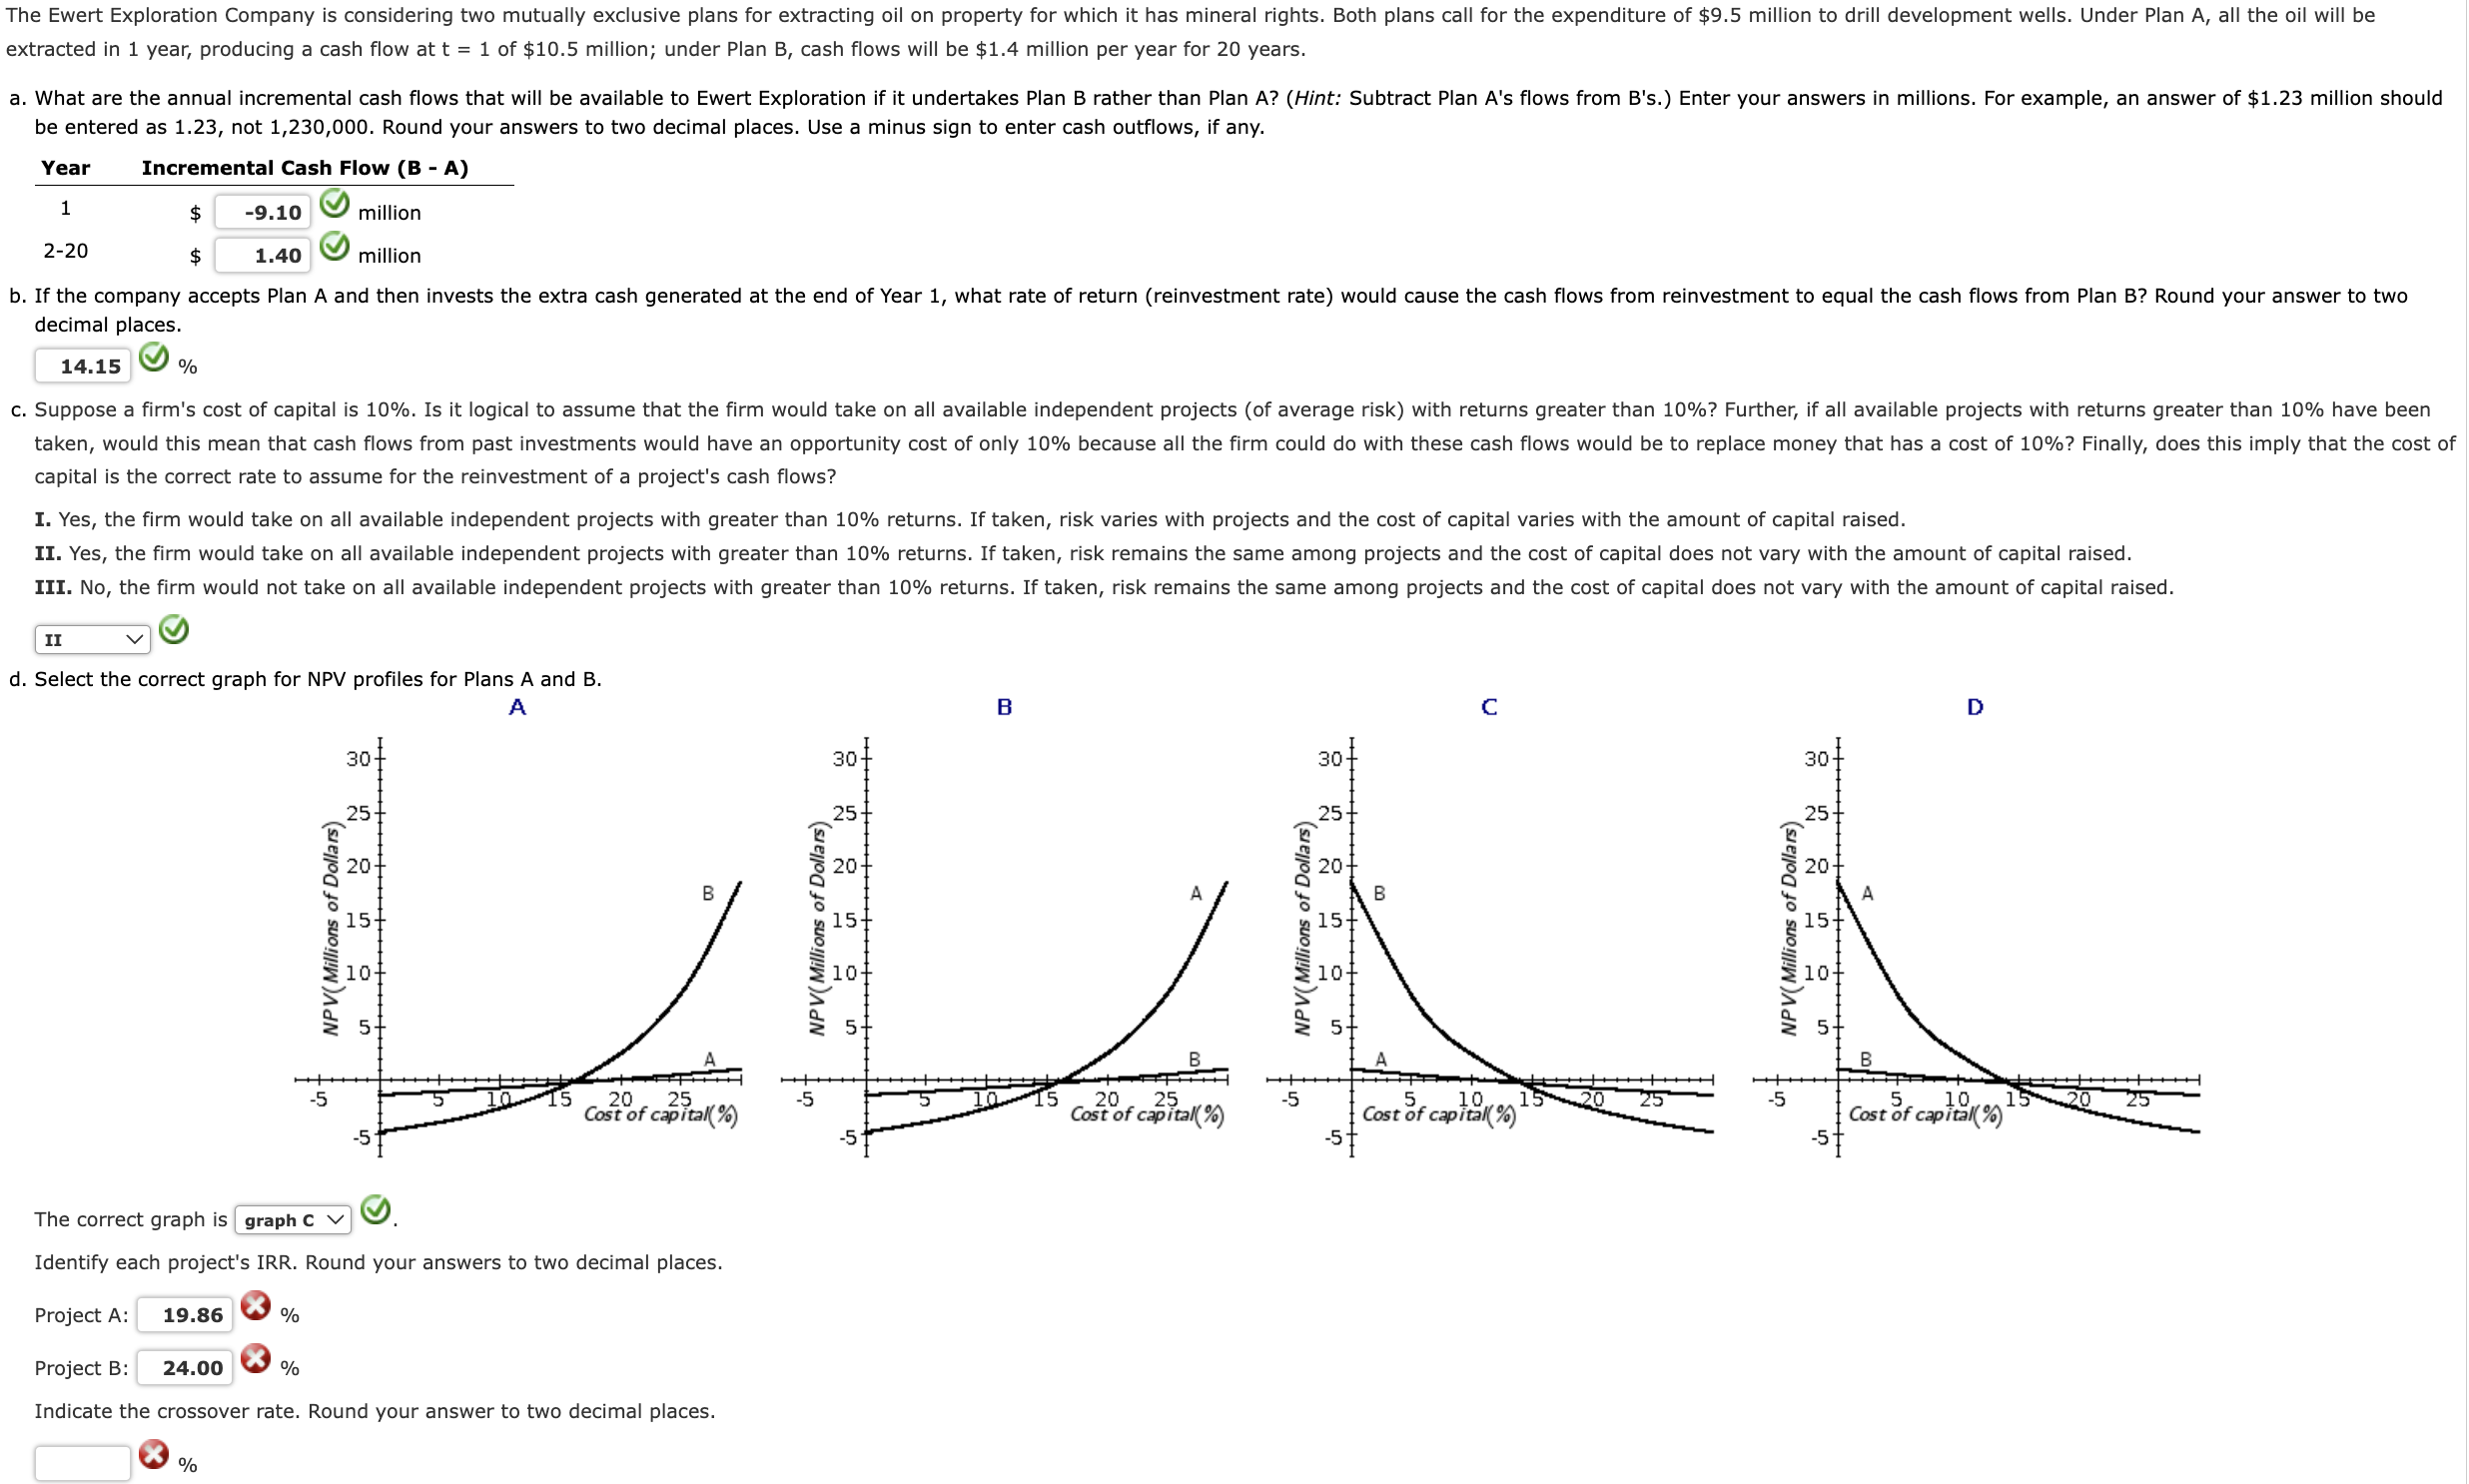
d Select the correct graph for NPV profiles for Plans A and B
A
B
C
D
The correct graph is cdots
Identify each project's IRR. Round your answers to two decimal places.
Project A:
Project B:
Indicate the crossover rate. Round your answer to two decimal places.
Step by Step Solution
There are 3 Steps involved in it
1 Expert Approved Answer
Step: 1 Unlock

Question Has Been Solved by an Expert!
Get step-by-step solutions from verified subject matter experts
Step: 2 Unlock
Step: 3 Unlock