

Question: d) The control limits for the R-chart are: Based on the x-chart, is one or more samples beyond the control limits? Yes/No Based on the

d) The control limits for the R-chart are:
Based on the x-chart, is one or more samples beyond the control limits? Yes/No
Based on the R-chart, is one or more samples beyond the control limits? Yes/No
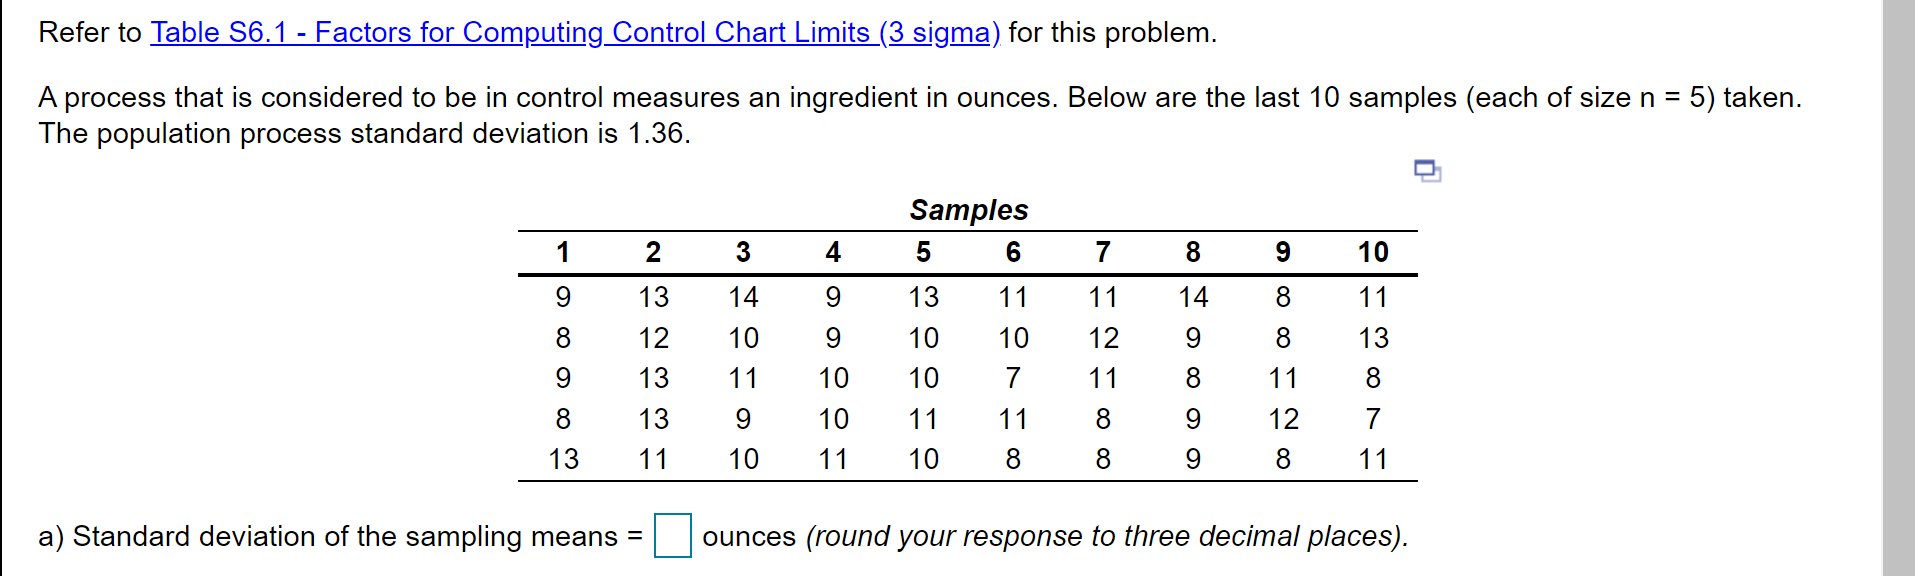
Refer to Table 56.1 - Factors for Computing Control Chart Limits (3 sigma) for this problem. = A process that is considered to be in control measures an ingredient in ounces. Below are the last 10 samples (each of size n = 5) taken. The population process standard deviation is 1.36. 1 2. 3 4 7 8 9 10 9 14 8 13 12 13 14 10 11 8 11 12 Samples 5 6 13 11 10 10 10 7 11 11 10 8 11 13 9 8 9 11 8 8 11 12 8 13 10 10 11 9 8 9 7 11 13 11 10 8 9 8 a) Standard deviation of the sampling means = ounces (round your response to three decimal places). b) With z = 3, the control limits for the mean chart are: UCLE ounces (round your response to three decimal places). LCL = ounces (round your response to three decimal places). c) The control limits for the R-chart are: UCLR ounces (round your response to three decimal places). LCLR ounces (round your response to three decimal places)Step by Step Solution
There are 3 Steps involved in it
1 Expert Approved Answer
Step: 1 Unlock

Question Has Been Solved by an Expert!
Get step-by-step solutions from verified subject matter experts
Step: 2 Unlock
Step: 3 Unlock