

Question: d) Use Excel Data Analysis function, at 0.01 significance level, compare the two paired sample mean, submit a screenshot of the result output. (t Stat

d) Use Excel Data Analysis function, at 0.01 significance level, compare the two paired sample mean, submit a screenshot of the result output. (t Stat from the output should match your answer in part c).e) Based on your answer from c) or d), at a = 0.01 level, what is your conclusion?
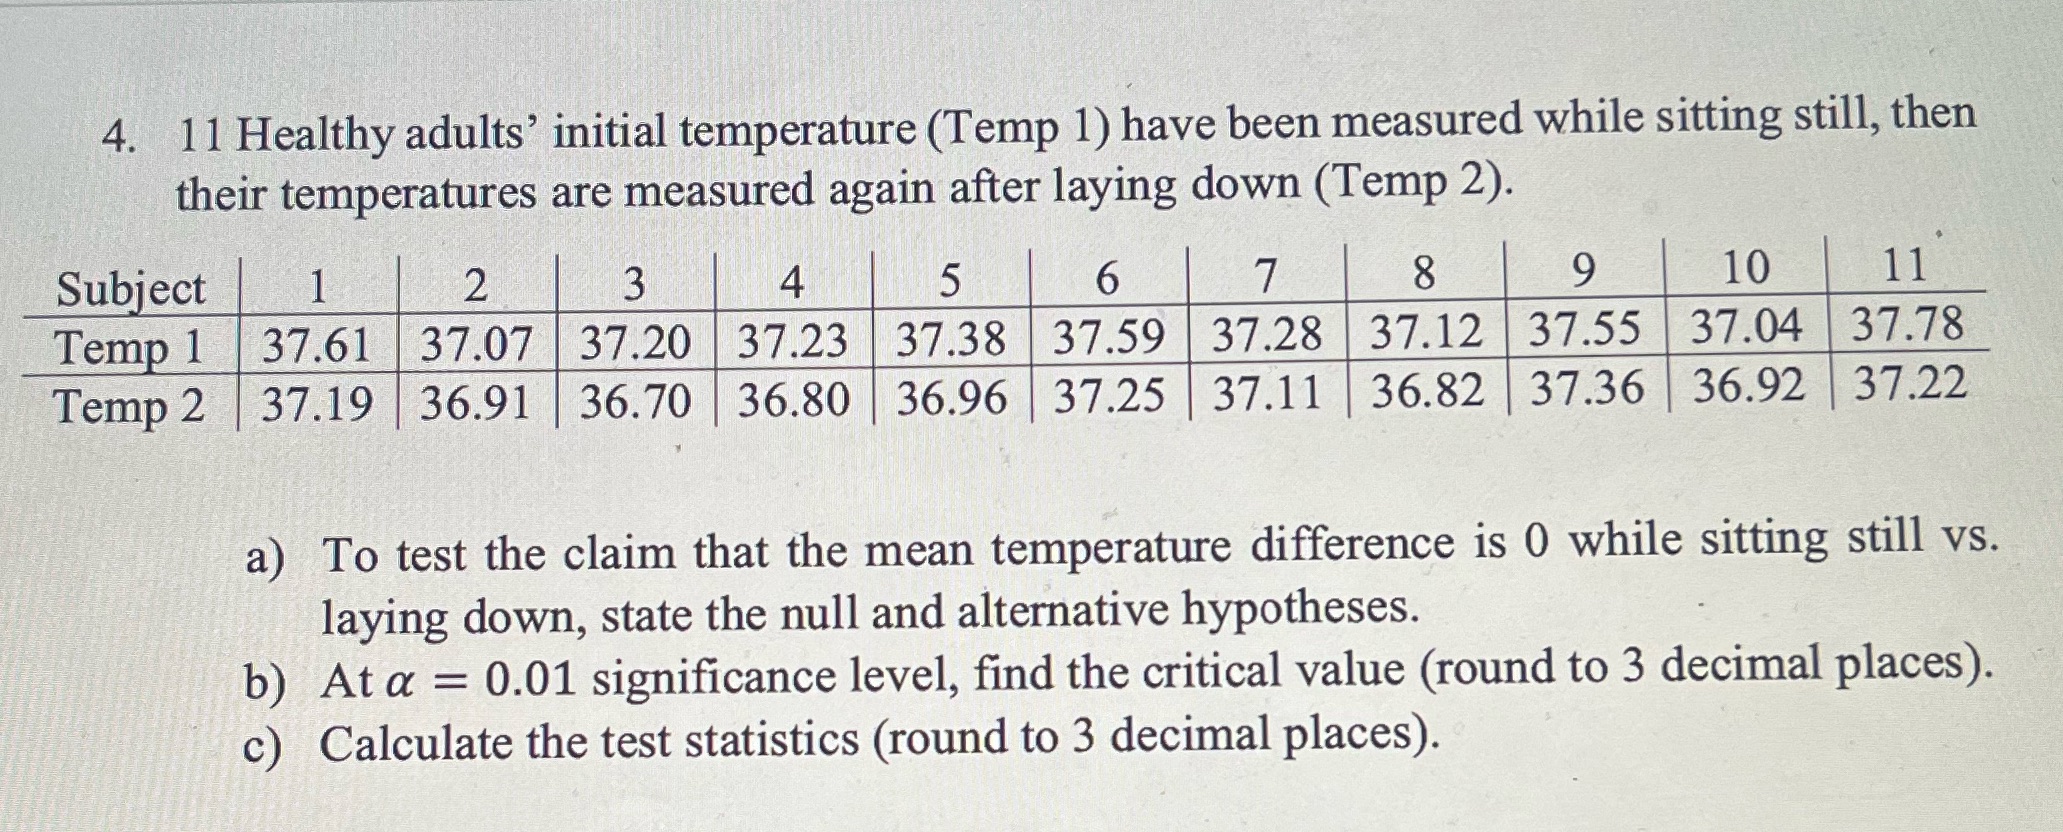
4. 1 1 Healthy adults' initial temperature (Temp 1) have been measured while sitting still, then their temperatures are measured again after laying down (Temp 2). Subject 2 3 4 5 6 7 8 9 10 11 Temp 1 37.61 37.07 37.20 37.23 37.38 37.59 37.28 37.12 37.55 37.04 37.78 Temp 2 37.19 36.91 36.70 36.80 36.96 37.25 37.11 36.82 37.36 36.92 37.22 a) To test the claim that the mean temperature difference is 0 while sitting still vs. laying down, state the null and alternative hypotheses. b) At a = 0.01 significance level, find the critical value (round to 3 decimal places). c) Calculate the test statistics (round to 3 decimal places)
Step by Step Solution
There are 3 Steps involved in it

Get step-by-step solutions from verified subject matter experts