

Question: d. Use R to plot a side-by-side boxplot comparing the calories in hot vs. cold cereals. What does this plot show us? ANS: This plot
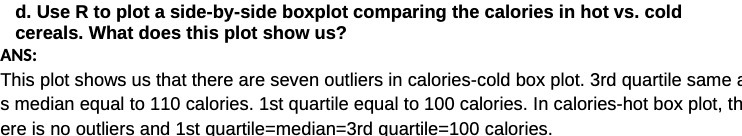
d. Use R to plot a side-by-side boxplot comparing the calories in hot vs. cold cereals. What does this plot show us? ANS: This plot shows us that there are seven outliers in calories-cold box plot. 3rd quartile same s median equal to 110 calories. 1st quartile equal to 100 calories. In calories-hot box plot, th ere is no outliers and 1st quartile=median=3rd quartile=100 calories
Step by Step Solution
There are 3 Steps involved in it
1 Expert Approved Answer
Step: 1 Unlock

Question Has Been Solved by an Expert!
Get step-by-step solutions from verified subject matter experts
Step: 2 Unlock
Step: 3 Unlock