

Question: D17 ft Standard Error E F H D Interval Estimation for the Difference Between Two Population Means, Sigma Known Case G Formulas #N/A #N/A #N/A
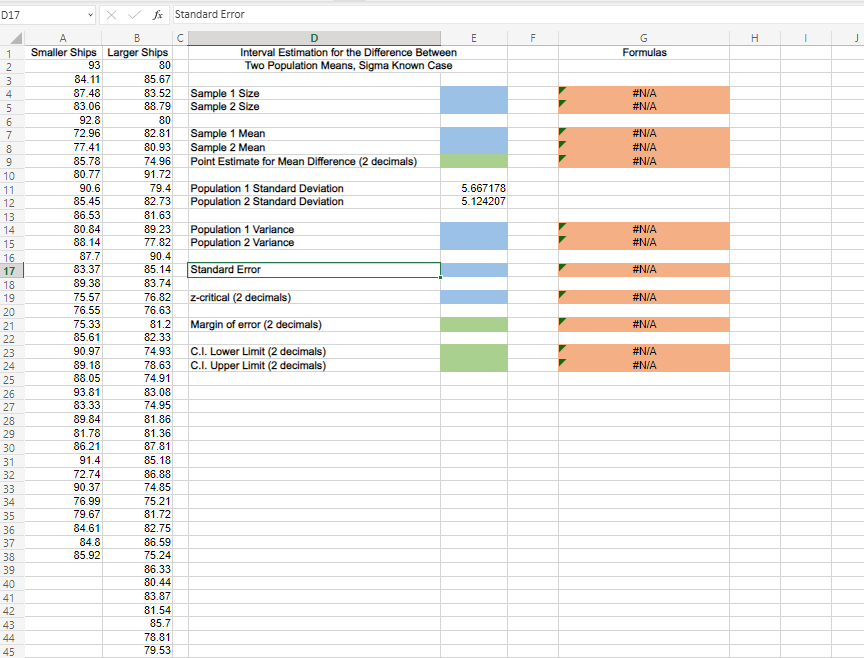
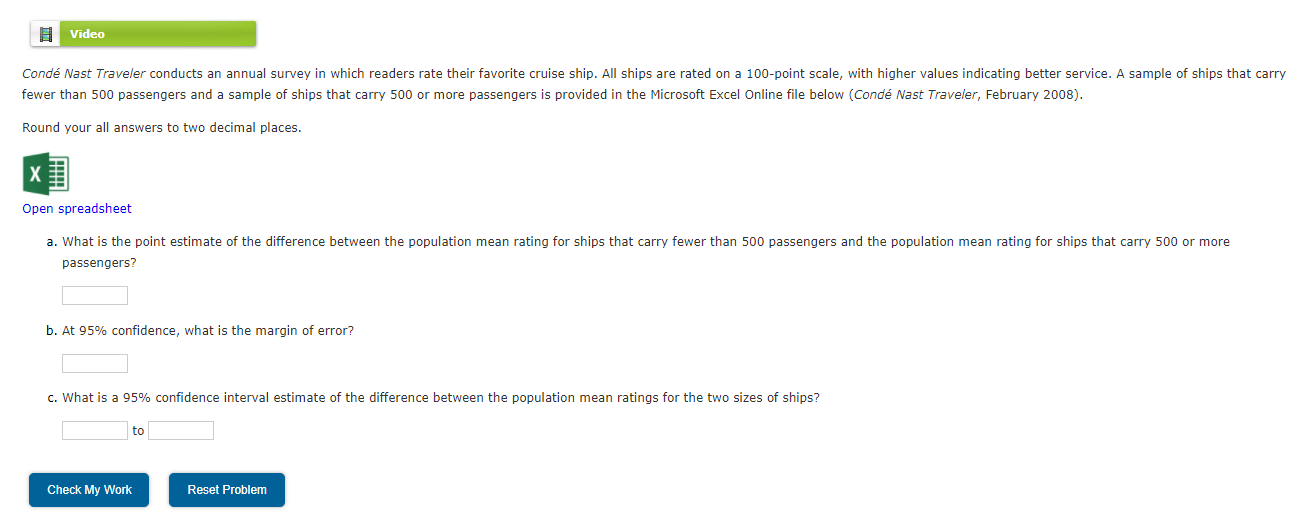
D17 ft Standard Error E F H D Interval Estimation for the Difference Between Two Population Means, Sigma Known Case G Formulas #N/A #N/A #N/A #N/A #N/A 5.667178 5.124207 #N/A #N/A Sample 1 Size Sample 2 Size Sample 1 Mean Sample 2 Mean Point Estimate for Mean Difference (2 decimals) Population 1 Standard Deviation Population 2 Standard Deviation Population 1 Variance Population 2 Variance Standard Error z-critical (2 decimals) Margin of error (2 decimals) C.I. Lower Limit (2 decimals) C.I. Upper Limit (2 decimals) #N/A #N/A MONEN & NASASAMA 21 A B C Smaller Ships Larger Ships 93 80 84.11 85.67 87.48 83.52 83.06 88.79 92.8 80 72.96 82.81 77.41 80.93 85.78 74.96 80.77 91.72 90.6 79.4 85.45 82.73 86.53 81.63 80.84 89.23 88.14 77.82 87.7 90.4 83.37 85.14 89.38 83.74 75.57 76.82 76.55 76.63 75.33 81.2 85.61 82.33 90.97 74.93 89.18 78.63 88.05 74.91 93.81 83.08 83.33 74.95 89.84 81.86 81.78 81.36 86.21 87.81 91.4 85.18 72.74 86.88 90.37 74.85 76.99 75.21 79.67 81.72 84.61 82.75 84.8 86.59 85.92 75.24 86.33 80.44 83.87 81.54 85.7 78.81 79.53 #N/A #N/A #N/A 27 28 36 38 40 45 Video Cond Nast Traveler conducts an annual survey in which readers rate their favorite cruise ship. All ships are rated on a 100-point scale, with higher values indicating better service. A sample of ships that carry fewer than 500 passengers and a sample of ships that carry 500 or more passengers is provided in the Microsoft Excel Online file below (Cond Nast Traveler, February 2008). Round your all answers to two decimal places. X Open spreadsheet a. What is the point estimate of the difference between the population mean rating for ships that carry fewer than 500 passengers and the population mean rating for ships that carry 500 or more passengers? b. At 95% confidence, what is the margin of error? c. What is a 95% confidence interval estimate of the difference between the population mean ratings for the two sizes of ships? to Check My Work Reset Problem D17 ft Standard Error E F H D Interval Estimation for the Difference Between Two Population Means, Sigma Known Case G Formulas #N/A #N/A #N/A #N/A #N/A 5.667178 5.124207 #N/A #N/A Sample 1 Size Sample 2 Size Sample 1 Mean Sample 2 Mean Point Estimate for Mean Difference (2 decimals) Population 1 Standard Deviation Population 2 Standard Deviation Population 1 Variance Population 2 Variance Standard Error z-critical (2 decimals) Margin of error (2 decimals) C.I. Lower Limit (2 decimals) C.I. Upper Limit (2 decimals) #N/A #N/A MONEN & NASASAMA 21 A B C Smaller Ships Larger Ships 93 80 84.11 85.67 87.48 83.52 83.06 88.79 92.8 80 72.96 82.81 77.41 80.93 85.78 74.96 80.77 91.72 90.6 79.4 85.45 82.73 86.53 81.63 80.84 89.23 88.14 77.82 87.7 90.4 83.37 85.14 89.38 83.74 75.57 76.82 76.55 76.63 75.33 81.2 85.61 82.33 90.97 74.93 89.18 78.63 88.05 74.91 93.81 83.08 83.33 74.95 89.84 81.86 81.78 81.36 86.21 87.81 91.4 85.18 72.74 86.88 90.37 74.85 76.99 75.21 79.67 81.72 84.61 82.75 84.8 86.59 85.92 75.24 86.33 80.44 83.87 81.54 85.7 78.81 79.53 #N/A #N/A #N/A 27 28 36 38 40 45 Video Cond Nast Traveler conducts an annual survey in which readers rate their favorite cruise ship. All ships are rated on a 100-point scale, with higher values indicating better service. A sample of ships that carry fewer than 500 passengers and a sample of ships that carry 500 or more passengers is provided in the Microsoft Excel Online file below (Cond Nast Traveler, February 2008). Round your all answers to two decimal places. X Open spreadsheet a. What is the point estimate of the difference between the population mean rating for ships that carry fewer than 500 passengers and the population mean rating for ships that carry 500 or more passengers? b. At 95% confidence, what is the margin of error? c. What is a 95% confidence interval estimate of the difference between the population mean ratings for the two sizes of ships? to Check My Work Reset
Step by Step Solution
There are 3 Steps involved in it

Get step-by-step solutions from verified subject matter experts