

Question: DA 1 4 . 1 Data visualization can be used to analyze trends in revenue Inditex is able to maintain a high and stable gross
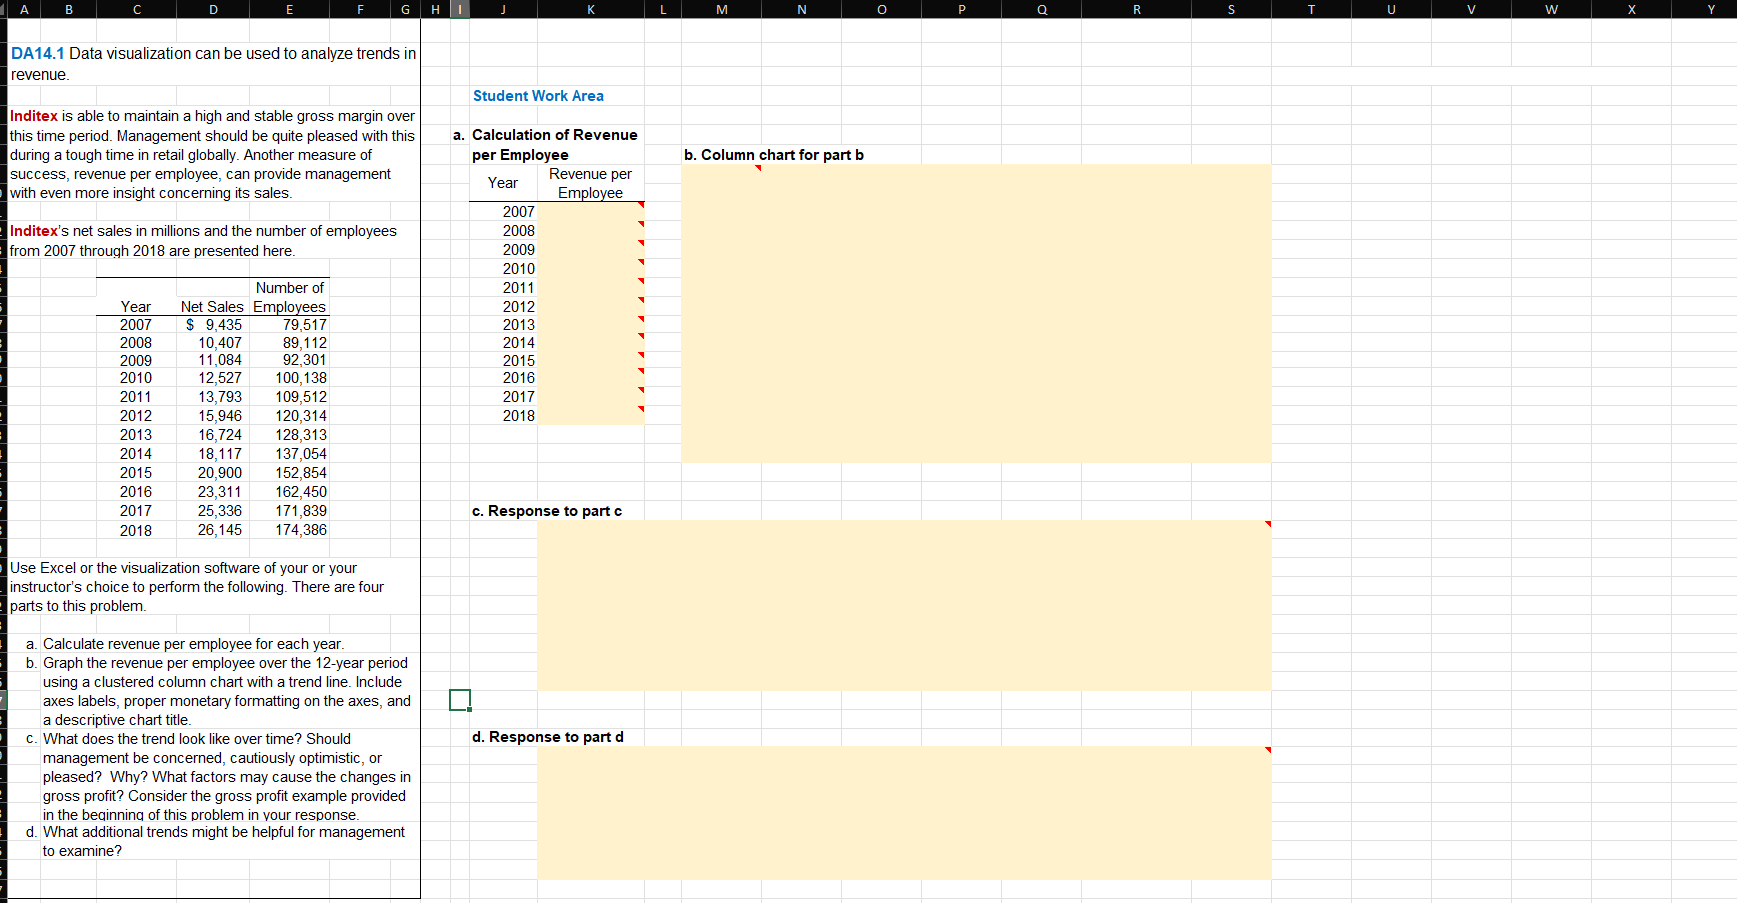
DA Data visualization can be used to analyze trends in
revenue
Inditex is able to maintain a high and stable gross margin over
this time period. Management should be quite pleased with this
during a tough time in retail globally. Another measure of
success, revenue per employee, can provide management
with even more insight concerning its sales.
Inditex's net sales in millions and the number of employees
from through are presented here.
Use Excel or the visualization software of your or your
instructor's choice to perform the following. There are four
parts to this problem.
a Calculate revenue per employee for each year.
b Graph the revenue per employee over the year period
using a clustered column chart with a trend line. Include
axes labels, proper monetary formatting on the axes, and
a descriptive chart title.
c What does the trend look like over time? Should
management be concerned, cautiously optimistic, or
pleased? Why? What factors may cause the changes in
gross profit? Consider the gross profit example provided
in the beqinning of this problem in vour response.
d What additional trends might be helpful for management
to examine?
Student Work Area
a Calculation of Revenue
per Employee
b Column chart for part b
d Response to part d
Step by Step Solution
There are 3 Steps involved in it
1 Expert Approved Answer
Step: 1 Unlock

Question Has Been Solved by an Expert!
Get step-by-step solutions from verified subject matter experts
Step: 2 Unlock
Step: 3 Unlock