

Question: PROBLEM 1 - Data visualization can be used to analyze trends in revenue. Refer to page 1-45 of your book. Inditex is able to maintain
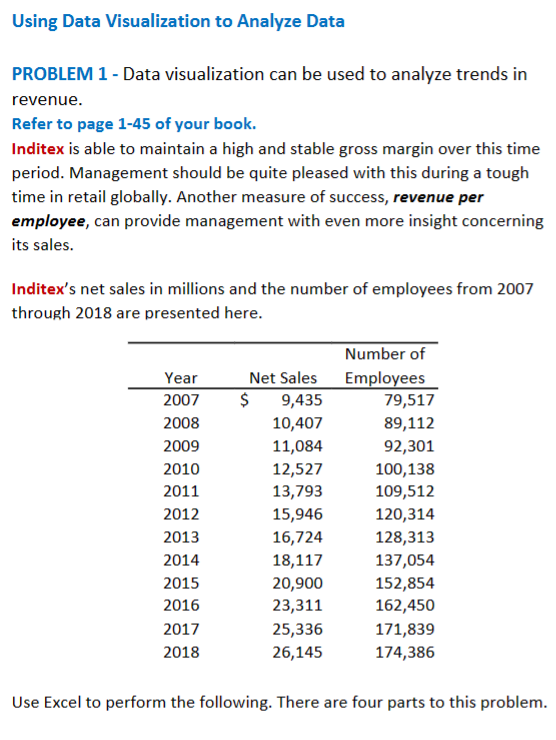
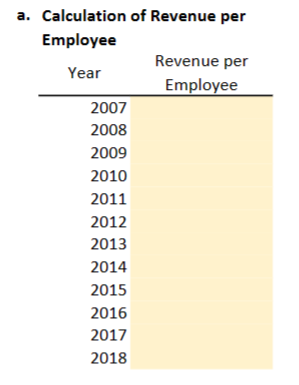
PROBLEM 1 - Data visualization can be used to analyze trends in revenue. Refer to page 1-45 of your book. Inditex is able to maintain a high and stable gross margin over this time period. Management should be quite pleased with this during a tough time in retail globally. Another measure of success, revenue per employee, can provide management with even more insight concerning its sales. Inditex's net sales in millions and the number of employees from 2007 through 2018 are presented here. Use Excel to perform the following. There are four parts to this problem. a. Calculation of Revenue per Employee \begin{tabular}{cc} Year & RevenueperEmployee \\ \hline 2007 & \\ 2008 & \\ 2009 & \\ 2010 \\ 2011 \\ 2012 & \\ 2013 & \\ 2014 & \\ 2015 & \\ 2016 & \\ 2017 & \\ 2018 \end{tabular}
Step by Step Solution
There are 3 Steps involved in it

Get step-by-step solutions from verified subject matter experts