

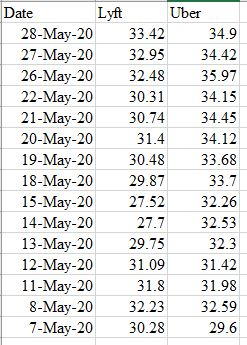
Daily changes in stock market prices (May 7-28th, 2020) Lyft vs Ubera. square the correlation coefficient and
Question:
Daily changes in stock market prices (May 7-28th, 2020) Lyft vs Ubera. square the correlation coefficient and briefly interpret it.b. compute the least-squares regression equation and draw the line on a scatterplot.c. for two elementary units in your data set, compute predicted values for Y and Residuals.d. find the confidence interval for the slope coefficient.e. test whether or not anything is being explained by regression equation.f. Choose a value of X. Find the expected value of Y for this X. Find the confidence interval for the Y value of an individual with this X value. Find the confidence interval for the population mean Y for individuals with this X value. Summarize and interpret these results.
Expert Answer:


Elementary Statistics
ISBN: 978-0538733502
11th edition
Authors: Robert R. Johnson, Patricia J. Kuby
