

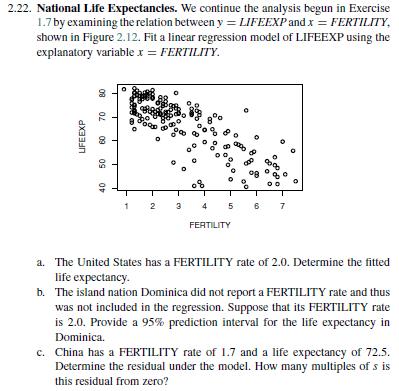
National Life Expectancies. We continue the analysis begun in Exercises 1.7and 2.22 Now fit a regression model
Question:
National Life Expectancies. We continue the analysis begun in Exercises 1.7and 2.22
Now fit a regression model on LIFEEXP using three explananatural logarithmic transform of PRIVATEHEALTH).
a. Interpret the regression coefficient associated with public education.
b. Interpret the regression coefficient associated with health expenditures without using the logarithmic scale for expenditures.
c. Based on the model fit, is PUBLICEDUCATION a statistically significant variable? To respond to this question, use a formal test of hypothesis. State your null and alternative hypotheses, decision-making criterion, and decision-making rule.
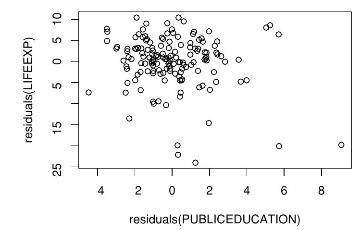
d. The negative sign of the PUBLICEDUCATION coefficient is surprising, in that the sign of the correlation between PUBLICEDUCATION and LIFEEXP is positive and intuition suggests a positive relation. To check this result, an added variable plot appears d(i). For an added variable plot, describe its purpose and a method for producing it.
d(ii). Calculate the correlation corresponding to the added variable plot that appears in Figure 3.11.
Step by Step Answer:
a The regression coefficient is 01846 meaning that when public education expenditures inc...View the full answer


Regression Modeling With Actuarial And Financial Applications
ISBN: 9780521135962
1st Edition
Authors: Edward W. Frees
