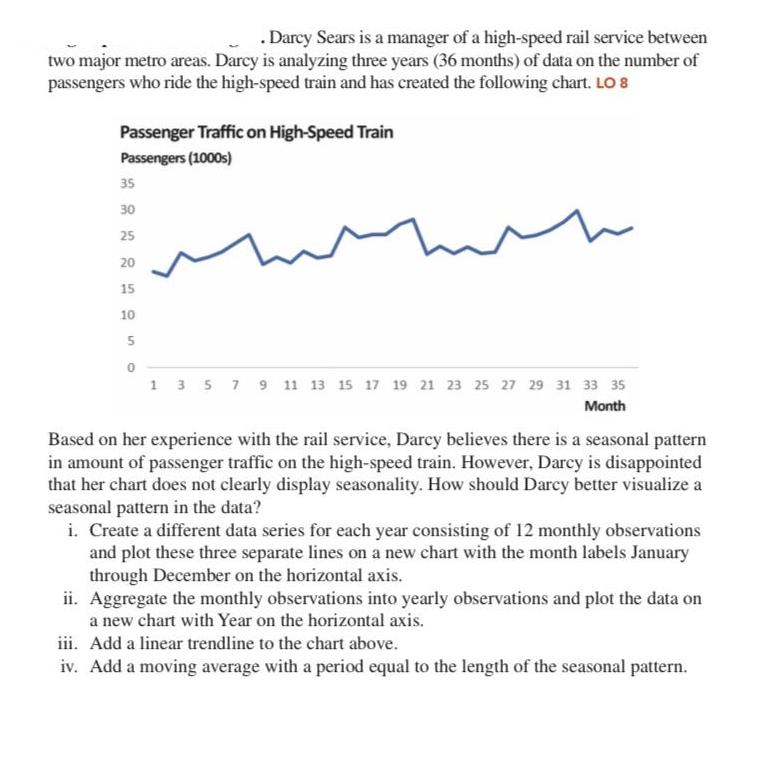
. Darcy Sears is a manager of a high-speed rail service between two major metro areas....
Fantastic news! We've Found the answer you've been seeking!
Question:
Transcribed Image Text:
. Darcy Sears is a manager of a high-speed rail service between two major metro areas. Darcy is analyzing three years (36 months) of data on the number of passengers who ride the high-speed train and has created the following chart. LO 8 Passenger Traffic on High-Speed Train Passengers (1000s) 35 30 25 20 15 10 5 0 1 3 5 7 9 11 13 15 17 19 21 23 25 27 29 31 33 35 Month Based on her experience with the rail service, Darcy believes there is a seasonal pattern in amount of passenger traffic on the high-speed train. However, Darcy is disappointed that her chart does not clearly display seasonality. How should Darcy better visualize a seasonal pattern in the data? i. Create a different data series for each year consisting of 12 monthly observations and plot these three separate lines on a new chart with the month labels January through December on the horizontal axis. ii. Aggregate the monthly observations into yearly observations and plot the data on a new chart with Year on the horizontal axis. iii. Add a linear trendline to the chart above. iv. Add a moving average with a period equal to the length of the seasonal pattern. The file TaxData contains information from federal tax returns filed in 2007 for all counties in the United States (3,142 counties in total). Create an Excel Table based on these data. Using Excel Table functionality, answer the following questions. a. Which county had the largest total adjusted gross income in the state of Texas? b. Which county had the largest average adjusted gross income in the state of Texas? . Darcy Sears is a manager of a high-speed rail service between two major metro areas. Darcy is analyzing three years (36 months) of data on the number of passengers who ride the high-speed train and has created the following chart. LO 8 Passenger Traffic on High-Speed Train Passengers (1000s) 35 30 25 20 15 10 5 0 1 3 5 7 9 11 13 15 17 19 21 23 25 27 29 31 33 35 Month Based on her experience with the rail service, Darcy believes there is a seasonal pattern in amount of passenger traffic on the high-speed train. However, Darcy is disappointed that her chart does not clearly display seasonality. How should Darcy better visualize a seasonal pattern in the data? i. Create a different data series for each year consisting of 12 monthly observations and plot these three separate lines on a new chart with the month labels January through December on the horizontal axis. ii. Aggregate the monthly observations into yearly observations and plot the data on a new chart with Year on the horizontal axis. iii. Add a linear trendline to the chart above. iv. Add a moving average with a period equal to the length of the seasonal pattern. The file TaxData contains information from federal tax returns filed in 2007 for all counties in the United States (3,142 counties in total). Create an Excel Table based on these data. Using Excel Table functionality, answer the following questions. a. Which county had the largest total adjusted gross income in the state of Texas? b. Which county had the largest average adjusted gross income in the state of Texas?
Expert Answer:
Answer rating: 100% (QA)
Step 12 Answer A Create a different data series for each year consisting of 12 monthly observations ... View the full answer
Related Book For
Business Statistics A Decision Making Approach
ISBN: 9780133021844
9th Edition
Authors: David F. Groebner, Patrick W. Shannon, Phillip C. Fry
Posted Date:
Students also viewed these accounting questions
-
A production manager has collected data on the number of units produced and the number of employees at work, for the day shift and the night shift. Is shift a significant explanatory variable for the...
-
A factory manager collected data on the number of equipment breakdowns per day. From those data, she derived the probability distribution shown in the following table, where W denotes the number of...
-
The accompanying frequency distribution summarizes data on the number of times smokers who had successfully quit smoking attempted to quit before their final successful attempt (Demographic...
-
Find the eccentricity and the distance from the pole to the directrix of the conic. Then identify the conic and sketch its graph. Use a graphing utility to confirm your results. r = 6 2 + cos 0
-
The state lotterys million-dollar payout provides for $1 million to be paid over the course of 19 years in amounts of $50,000. The first $50,000 payment is made immediately, and the 19 remaining...
-
The proportion of people who respond to a certain mail-order solicitation is a random variable X having the density function given in Exercise 4.14. Find the variance of X.
-
A university pumps its water from wells located on campus. The falling water table has caused pumping costs to increase, the quantity of water available to decrease, and the quality of water to...
-
Gross Profit Method Astaire Company uses the gross profit method to estimate inventory for monthly reporting purposes. Presented below is information for the month of May. Inventory, May...
-
17.4 Suppose that, for R R. Let {c} be the Laurent coefficients of in the annulus R < || < S. Prove, by considering the expansions of g and h, that 9(z) = c + cnzn (|z|
-
Since 1970, Super Rise, Inc., has provided maintenance services for elevators. On January 1, 2024, Super Rise obtains a contract to maintain an elevator in a 90-story building in New York City for 10...
-
Assuming semiannual compounding, a 15-year zero coupon bond with a par value of $1,000 and a required return of 12.2% would have a price of _________.
-
what steps/How starbuck company take in their digital transformation. The pros and cons of their digital trasformation. write down the references too
-
I have been working on hypothetical situations in Business for practice. Getting stumped on a couple of questions, I come here for a better understanding. A maker and wholesaler of hats, HatsCo...
-
According to the WBS below, Identify the project boundaries, what is included in this capstone research project ? Also identify, to the level of detail appropriate for this template (template is...
-
Python help. Getting error on line 26. Correct the error. # dictionary of rooms and items rooms = { 'Hospital Room': {'East': 'Hall', 'item': 'None'}, 'Hall': {'East': 'Nurses Station', 'North':...
-
Several years into the crisis, the Greek government debt stands at around 180% of GDP and the jobless rate among youth is above 50%. The country's GDP declined by about 25%. Severe austerity...
-
You are a manager of a team that has been experiencing a decline in productivity and motivation. What strategies or actions would you implement to improve the team's performance and boost their...
-
Sandcastles, Inc.s management has recently been looking at a proposal to purchase a new brick molding machine. With the new machine, the company would not have to buy bricks. The estimated useful...
-
In an article titled Airport Screeners Strains, Sprains Highest among Workers, Thomas Frank reported that the injury rate for airport screeners was 29%, far exceeding the 4.5% injury rate for the...
-
Students attending West Valley Community College buy their textbooks online from one of two different book sellers because the college does not have a bookstore. The following data represent sample...
-
The marketing manager for a major retail grocery chain is wondering about the location of the stores dairy products. She believes that the mean amount spent by customers on dairy products per visit...
-
Answer the following questions: 1. Name at least five industries that might be affected by weather. 2. Is it appropriate for the forensic accountant/fraud examiner to examine the effect of weather?...
-
Discuss why collusive frauds, especially when perpetrated among related parties, is particularly difficult to detect?
-
In what year was the original company formed?
Study smarter with the SolutionInn App