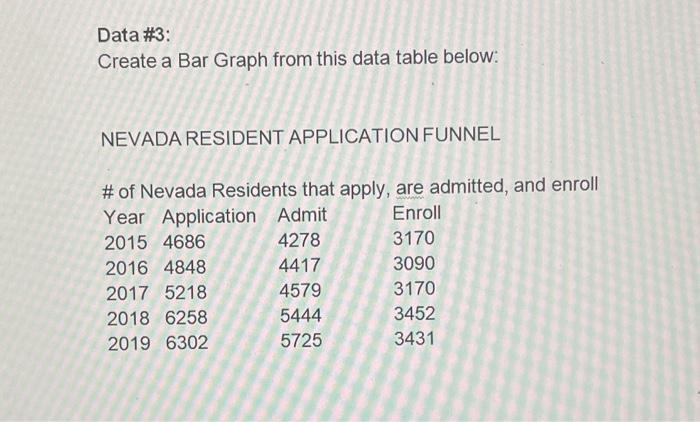
Question: Data #3: Create a Bar Graph from this data table below: NEVADA RESIDENT APPLICATION FUNNEL # of Nevada Residents that apply, are admitted, and enroll

Data #3: Create a Bar Graph from this data table
Data #3: Create a Bar Graph from this data table below: NEVADA RESIDENT APPLICATION FUNNEL # of Nevada Residents that apply, are admitted, and enroll Year Application Admit Enroll 2015 4686 4278 3170 2016 4848 4417 3090 2017 5218 4579 3170 2018 6258 5444 3452 2019 6302 5725 3431

Step by Step Solution

There are 3 Steps involved in it

1 Expert Approved Answer
Step: 1 Unlock blur-text-image
Question Has Been Solved by an Expert!

Get step-by-step solutions from verified subject matter experts

Step: 2 Unlock
Step: 3 Unlock

Students Have Also Explored These Related General Management Questions!