

Question: DATA: After making sure that the cash-flow models for all scenarios are correct according to the solution provided for Homework-2, use the NCF After Tax
DATA:

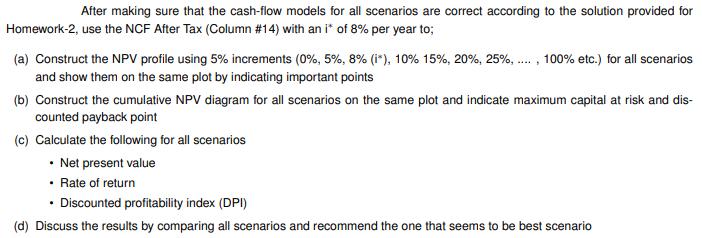
After making sure that the cash-flow models for all scenarios are correct according to the solution provided for Homework-2, use the NCF After Tax (Column # 14) with an i* of 8% per year to; (a) Construct the NPV profile using 5% increments (0%, 5%, 8% (i*), 10% 15%, 20%, 25%, ...., 100% etc.) for all scenarios and show them on the same plot by indicating important points (b) Construct the cumulative NPV diagram for all scenarios on the same plot and indicate maximum capital at risk and dis- counted payback point (c) Calculate the following for all scenarios Net present value Rate of return Discounted profitability index (DPI) (d) Discuss the results by comparing all scenarios and recommend the one that seems to be best scenario
Step by Step Solution
3.33 Rating (168 Votes )
There are 3 Steps involved in it
NPV Profile Cumulative NPV Diagram and Scenario Comparison a NPV Profile The NPV profile for all sce... View full answer

Get step-by-step solutions from verified subject matter experts