

Question: The graph in Figure 38.34 shows the stopping potential as a function of the frequency of the incident light falling on a metal surface,(a) Find
The graph in Figure 38.34 shows the stopping potential as a function of the frequency of the incident light falling on a metal surface,(a) Find the photoelectric work function for this metal.(b) What value of Planck's constant does the graph yield?(c) Why does the graph not extend below the x-axis?(d) If a different metal were used, what characteristics of the graph would you expect to be the same and which ones to bedifferent?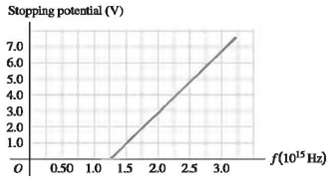
Stopping potential (V) 7.0 6.0 5.0 4.0 3.0 2.0 1.0 0 0.50 1.0 1.5 2.0 2.5 3.0 f(105 Hz)
Step by Step Solution
3.41 Rating (164 Votes )
There are 3 Steps involved in it
The IDENTIFY and SET UP The stopping potential Vo is related to the freque... View full answer

Get step-by-step solutions from verified subject matter experts
Document Format (1 attachment)
P-M-P-P-E-A (1).docx
120 KBs Word File