

Question: Data Analysis 1. Open a spreadsheet program, like Excel or Desmos, and plot your data pointeywith Absorbance on the yaxis and Concentration on the x-axis.
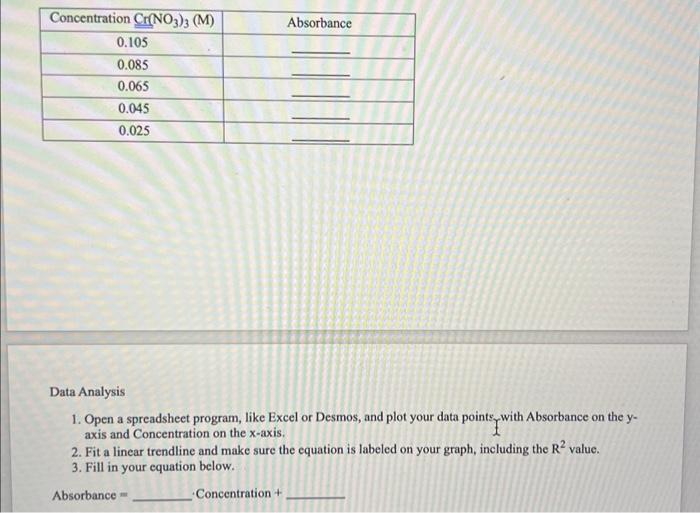
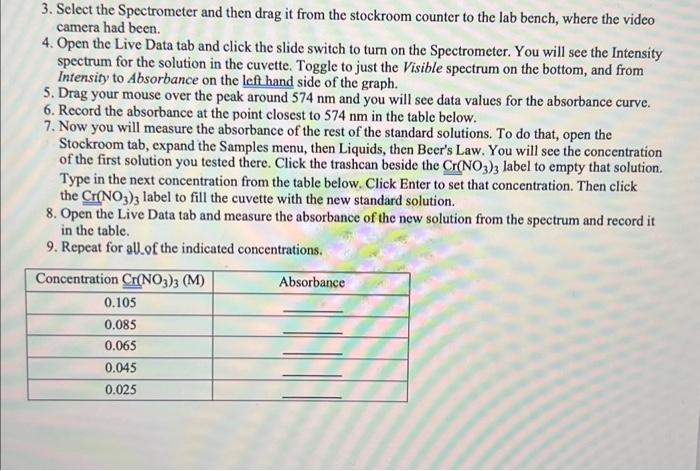
Data Analysis 1. Open a spreadsheet program, like Excel or Desmos, and plot your data pointeywith Absorbance on the yaxis and Concentration on the x-axis. 2. Fit a linear trendline and make sure the equation is labeled on your graph, including the R2 value. 3. Fill in your equation below. Absorbance = Concentration + 3. Select the Spectrometer and then drag it from the stockroom counter to the lab bench, where the video camera had been. 4. Open the Live Data tab and click the slide switch to turn on the Spectrometer. You will see the Intensity spectrum for the solution in the cuvette. Toggle to just the Visible spectrum on the bottom, and from Intensity to Absorbance on the left hand side of the graph. 5. Drag your mouse over the peak around 574nm and you will see data values for the absorbance curve. 6. Record the absorbance at the point closest to 574nm in the table below. 7. Now you will measure the absorbance of the rest of the standard solutions. To do that, open the Stockroom tab, expand the Samples menu, then Liquids, then Beer's Law. You will see the concentration of the first solution you tested there. Click the trashcan beside the Cr(NO3)3 label to empty that solution. Type in the next concentration from the table below. Click Enter to set that concentration. Then click the Cr(NO3)3 label to fill the cuvette with the new standard solution. 8. Open the Live Data tab and measure the absorbance of the new solution from the spectrum and record it in the table. 9. Repeat for allof the indicated concentrations. Data Analysis 1. Open a spreadsheet program, like Excel or Desmos, and plot your data pointeywith Absorbance on the yaxis and Concentration on the x-axis. 2. Fit a linear trendline and make sure the equation is labeled on your graph, including the R2 value. 3. Fill in your equation below. Absorbance = Concentration + 3. Select the Spectrometer and then drag it from the stockroom counter to the lab bench, where the video camera had been. 4. Open the Live Data tab and click the slide switch to turn on the Spectrometer. You will see the Intensity spectrum for the solution in the cuvette. Toggle to just the Visible spectrum on the bottom, and from Intensity to Absorbance on the left hand side of the graph. 5. Drag your mouse over the peak around 574nm and you will see data values for the absorbance curve. 6. Record the absorbance at the point closest to 574nm in the table below. 7. Now you will measure the absorbance of the rest of the standard solutions. To do that, open the Stockroom tab, expand the Samples menu, then Liquids, then Beer's Law. You will see the concentration of the first solution you tested there. Click the trashcan beside the Cr(NO3)3 label to empty that solution. Type in the next concentration from the table below. Click Enter to set that concentration. Then click the Cr(NO3)3 label to fill the cuvette with the new standard solution. 8. Open the Live Data tab and measure the absorbance of the new solution from the spectrum and record it in the table. 9. Repeat for allof the indicated concentrations
Step by Step Solution
There are 3 Steps involved in it

Get step-by-step solutions from verified subject matter experts