

Question: Data Analysis Part one: 1. Uses excel software and plot a graph relates Fo and r. Write comments on the graph. 2- Uses excel and
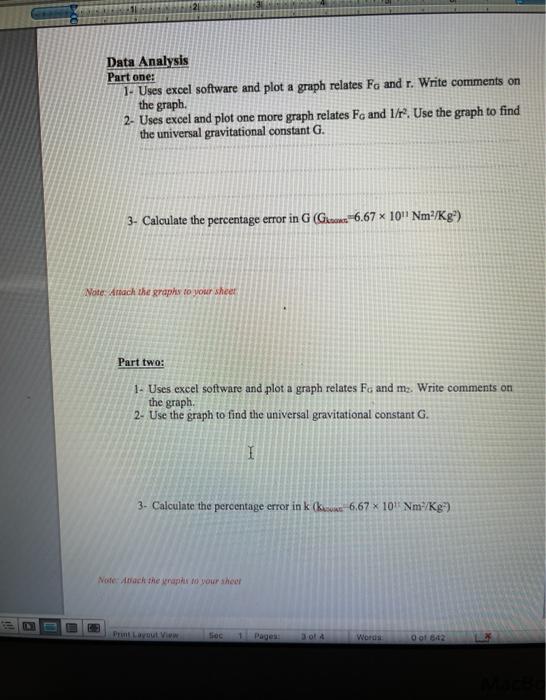
Data Analysis Part one: 1. Uses excel software and plot a graph relates Fo and r. Write comments on the graph. 2- Uses excel and plot one more graph relates FG and 1/r? Use the graph to find the universal gravitational constant G. 3- Calculate the percentage error in G (Gone -6.67 x 10" Nm /kg) Note Attach the graphs to your sheer Part two: 1. Uses excel software and plot a graph relates Fo and m2. Write comments on the graph 2- Use the graph to find the universal gravitational constant G. I 3. Calculate the percentage error in ki (kw 6.67 * 10" Nm-/Kg) Note ach therapy to your sheer Layout View log Words Oo842
Step by Step Solution
There are 3 Steps involved in it
1 Expert Approved Answer
Step: 1 Unlock

Question Has Been Solved by an Expert!
Get step-by-step solutions from verified subject matter experts
Step: 2 Unlock
Step: 3 Unlock