

Question: Data Analytics Problem DAPS.1 Data Analytics Wheels and Skis Inc. is a seasonal business that sells bikes and skis. Offering products for both summer
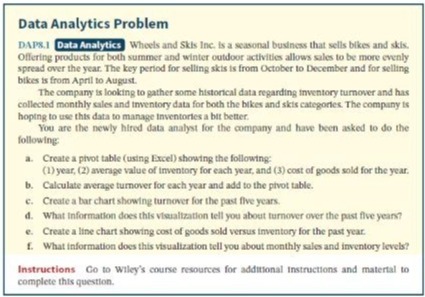
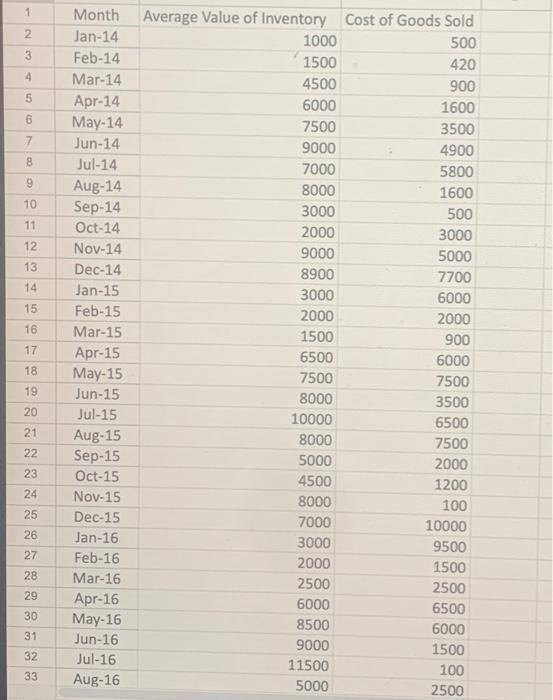
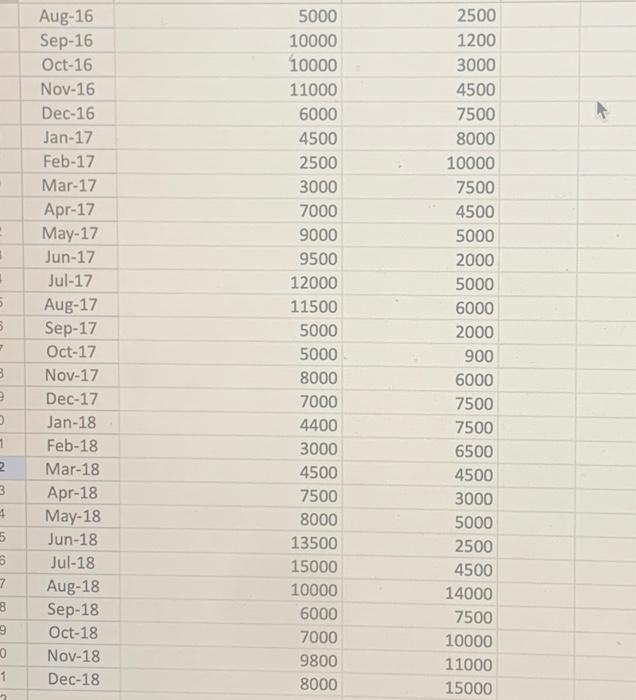
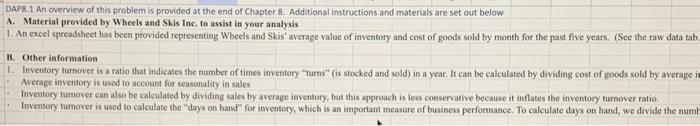
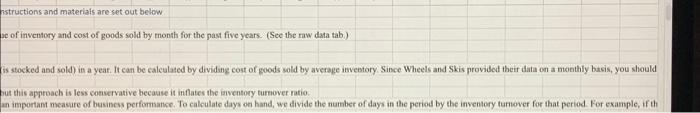
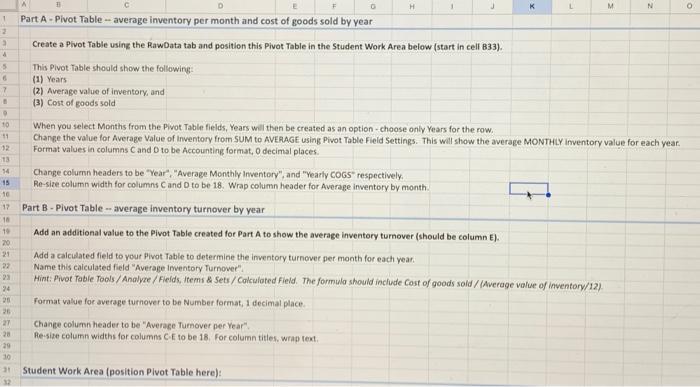
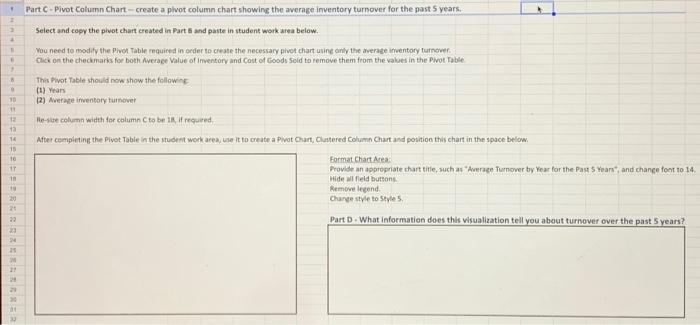
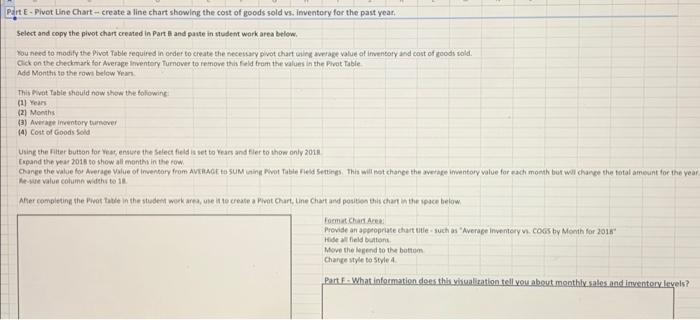
Data Analytics Problem DAPS.1 Data Analytics Wheels and Skis Inc. is a seasonal business that sells bikes and skis. Offering products for both summer and winter outdoor activities allows sales to be more evenly spread over the year. The key period for selling skis is from October to December and for selling bikes is from April to August. The company is looking to gather some historical data regarding inventory turnover and has collected monthly sales and inventory data for both the bikes and skis categories. The company is hoping to use this data to manage Inventories a bit better. You are the newly hired data analyst for the company and have been asked to do the following: a. Create a pivot table (using Excel) showing the following: (1) year, (2) average value of inventory for each year, and (3) cost of goods sold for the year. b. Calculate average turnover for each year and add to the pivot table. c. Create a bar chart showing turnover for the past five years. d. What Information does this visualization tell you about turnover over the past five years? e. Create a line chart showing cost of goods sold versus inventory for the past year. f. What information does this visualization tell you about monthly sales and inventory levels? Instructions Go to Wiley's course resources for additional Instructions and material to complete this question. 1 Month Average Value of Inventory Cost of Goods Sold 2 Jan-14 1000 500 3 Feb-14 1500 420 4 Mar-14 4500 900 5 Apr-14 6000 1600 6 May-14 7500 3500 7 Jun-14 9000 4900 8 Jul-14 7000 5800 9 Aug-14 8000 1600 10 Sep-14 3000 500 11 Oct-14 2000 3000 12 Nov-14 9000 5000 13 Dec-14 8900 7700 14 Jan-15 3000 6000 15 Feb-15 2000 2000 16 Mar-15 1500 900 17 Apr-15 6500 6000 18 May-15 7500 7500 19 Jun-15 8000 3500 20 Jul-15 10000 6500 21 Aug-15 8000 7500 22 Sep-15 5000 2000 23 Oct-15 4500 1200 24 Nov-15 8000 100 25 Dec-15 7000 10000 26 Jan-16 3000 9500 27 Feb-16 2000 1500 28 Mar-16 2500 2500 29 Apr-16 6000 6500 30 May-16 8500 6000 31 Jun-16 9000 1500 32 Jul-16 11500 100 33 Aug-16 5000 2500 Aug-16 5000 2500 Sep-16 10000 1200 Oct-16 10000 3000 Nov-16 11000 4500 Dec-16 6000 7500 Jan-17 4500 8000 Feb-17 2500 10000 Mar-17 3000 7500 Apr-17 7000 4500 May-17 9000 5000 Jun-17 9500 2000 Jul-17 12000 5000 5 Aug-17 11500 6000 S Sep-17 5000 2000 , Oct-17 5000 900 B Nov-17 8000 6000 9 Dec-17 7000 7500 Jan-18 4400 7500 1 Feb-18 3000 6500 2 Mar-18 4500 4500 3 Apr-18 7500 3000 4 May-18 8000 5000 5 Jun-18 13500 2500 6 Jul-18 15000 4500 7 Aug-18 10000 14000 8 Sep-18 6000 7500 9 Oct-18 7000 10000 0 Nov-18 9800 11000 1 Dec-18 8000 15000 DAP8.1. An overview of this problem is provided at the end of Chapter 8. Additional instructions and materials are set out below A. Material provided by Wheels and Skis Inc. to assist in your analysis 1. An excel spreadsheet has been provided representing Wheels and Skis' average value of inventory and cost of goods sold by month for the past five years. (See the raw data tab.. B. Other information 1. Inventory turnover is a ratio that indicates the number of times inventory "turns" (is stocked and sold) in a year. It can be calculated by dividing cost of goods sold by average in Average inventory is used to account for seasonality in sales Inventory turnover can also be calculated by dividing sales by average inventory, but this approach is less conservative because it inflates the inventory turnover ratio. Inventory turnover is used to calculate the "days on hand" for inventory, which is an important measure of business performance. To calculate days on hand, we divide the numb nstructions and materials are set out below e of inventory and cost of goods sold by month for the past five years. (See the raw data tab.) is stocked and sold) in a year. It can be calculated by dividing cost of goods sold by average inventory. Since Wheels and Skis provided their data on a monthly basis, you should but this approach is less conservative because it inflates the inventory turnover ratio. an important measure of business performance. To calculate days on hand, we divide the number of days in the period by the inventory turnover for that period. For example, if th 0 H 1 J K L M N Part A-Pivot Table-average inventory per month and cost of goods sold by year 2 Create a Pivot Table using the RawData tab and position this Pivot Table in the Student Work Area below (start in cell 833). 4 5 This Pivot Table should show the following: 6 (1) Years 7 (2) Average value of inventory, and (3) Cost of goods sold 10 When you select Months from the Pivot Table fields, Years will then be created as an option-choose only Years for the row. 11 12 Change the value for Average Value of Inventory from SUM to AVERAGE using Pivot Table Field Settings. This will show the average MONTHLY Inventory value for each year. Format values in columns C and D to be Accounting format, 0 decimal places. 13 14 Change column headers to be "Year", "Average Monthly Inventory", and "Yearly COGS" respectively. 15 Re-size column width for columns C and D to be 18. Wrap column header for Average inventory by month. 16 17 Part B-Pivot Table-average inventory turnover by year 18 19 Add an additional value to the Pivot Table created for Part A to show the average inventory turnover (should be column E). 20 21 Add a calculated field to your Pivot Table to determine the inventory turnover per month for each year. 22 Name this calculated field "Average Inventory Turnover". 23 Hint: Pivot Table Tools/Analyze / Fields, Items & Sets/Calculated Field. The formula should include Cost of goods sold/(Average value of inventory/12) 24 20 Format value for average turnover to be Number format, 1 decimal place. 26 27 Change column header to be "Average Turnover per Year" 28 Re-size column widths for columns C-E to be 18. For column titles, wrap text. 29 30 21 Student Work Area (position Pivot Table here): 32 Part C - Pivot Column Chart-create a pivot column chart showing the average inventory turnover for the past 5 years. 3 Select and copy the pivot chart created in Part 6 and paste in student work area below. 4 B You need to modify the Pivot Table required in order to create the necessary pivot chart using only the average inventory turnover. Click on the checkmarks for both Average Value of Inventory and Cost of Goods Sold to remove them from the values in the Pivot Table. This Pivot Table should now show the following (1) Years 30 (2) Average inventory to y turnover 12 13 14 15 16 17 18 19 20 21 22 23 24 25 21 Re-size column width for column C to be 18, if required After completing the Pivot Table in the student work area, use it to create a Pivot Chart, Clustered Column Chart and position this chart in the space below. Format Chart Area: Provide an appropriate chart title, such as "Average Turnover by Year for the Past 5 Years", and change font to 14. Hide all field buttons. Remove legend. Change style to Style 5. Part D What information does this visualization tell you about turnover over the past 5 years? Part E-Pivot Line Chart-create a line chart showing the cost of goods sold vs. inventory for the past year. Select and copy the pivot chart created in Part B and paste in student work area below. You need to modify the Pivot Table required in order to create the necessary pivot chart using average value of inventory and cost of goods sold. Click on the checkmark for Average Inventory Turnover to remove this field from the values in the Pivot Table Add Months to the rows below Years. This Pivot Table should now show the following (1) Years (2) Months (3) Average Inventory turnover (4) Cost of Goods Sold Using the Filter button for Year, ensure the Select field is set to Years and filer to show only 2018 Expand the year 2018 to show all months in the row. Change the value for Average Value of Inventory from AVERAGE to SUM using Pivot Table Field Settings. This will not change the average inventory value for each month but will change the total amount for the year. Re-size value column widths to 18 After completing the Pivot Table in the student work area, use it to create a Pivot Chart, Line Chart and position this chart in the space below Format Chart Area: Provide an appropriate chart title such as "Average Inventory vs. COGS by Month for 2018" Hide all field buttons Move the legend to the bottom Change style to Style 4. Part F-What information does this visualization tell you about monthly sales and inventory levels? 1 Part G-How can this exercise help Wheels and Skis to better manage inventories? 2 3 4 5 6 7 8 9 10. 11 12 13
Step by Step Solution
There are 3 Steps involved in it
Based on the requirements for the Data Analytics Problem for Wheels and Skis Inc Ill provide a structured approach to setting up the calculations and present them in tabular form Heres how the answers ... View full answer

Get step-by-step solutions from verified subject matter experts