

Question: Data as given in the problem are shown below: Goodman Industries Yearl Stock Price Dividend 2020 $30.32 $2.23 2019 $23.53 $2.65 2018 $28.61 $2.73 2017
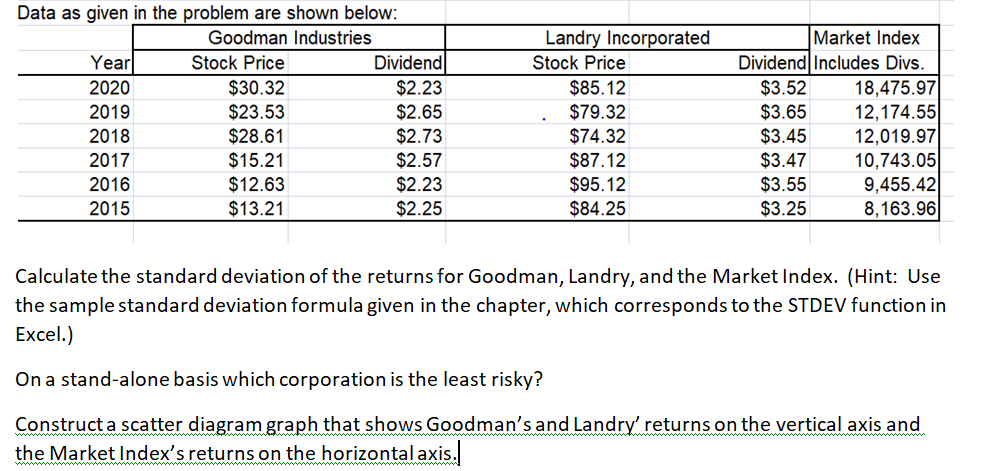
Data as given in the problem are shown below: Goodman Industries Yearl Stock Price Dividend 2020 $30.32 $2.23 2019 $23.53 $2.65 2018 $28.61 $2.73 2017 $15.21 $2.57 2016 $12.63 $2.23 2015 $13.21 $2.25 Landry Incorporated Stock Price $85.12 $79.32 $74.32 $87.12 $95.12 $84.25 Market Index Dividend Includes Divs. $3.52 18,475.97 $3.65 12,174.55 $3.45 12,019.97 $3.47 10,743.05 $3.55 9,455.42 $3.25 8,163.96 Calculate the standard deviation of the returns for Goodman, Landry, and the Market Index. (Hint: Use the sample standard deviation formula given in the chapter, which corresponds to the STDEV function in Excel.) On a stand-alone basis which corporation is the least risky? Construct a scatter diagram graph that shows Goodman's and Landry' returns on the vertical axis and the Market Index's returns on the horizontal axis. Data as given in the problem are shown below: Goodman Industries Yearl Stock Price Dividend 2020 $30.32 $2.23 2019 $23.53 $2.65 2018 $28.61 $2.73 2017 $15.21 $2.57 2016 $12.63 $2.23 2015 $13.21 $2.25 Landry Incorporated Stock Price $85.12 $79.32 $74.32 $87.12 $95.12 $84.25 Market Index Dividend Includes Divs. $3.52 18,475.97 $3.65 12,174.55 $3.45 12,019.97 $3.47 10,743.05 $3.55 9,455.42 $3.25 8,163.96 Calculate the standard deviation of the returns for Goodman, Landry, and the Market Index. (Hint: Use the sample standard deviation formula given in the chapter, which corresponds to the STDEV function in Excel.) On a stand-alone basis which corporation is the least risky? Construct a scatter diagram graph that shows Goodman's and Landry' returns on the vertical axis and the Market Index's returns on the horizontal axis
Step by Step Solution
There are 3 Steps involved in it

Get step-by-step solutions from verified subject matter experts