

Question: Data between 1 9 9 1 and 1 9 9 6 is provided. Also provided is the trend analysis output for a time series recording
Data between and is provided.
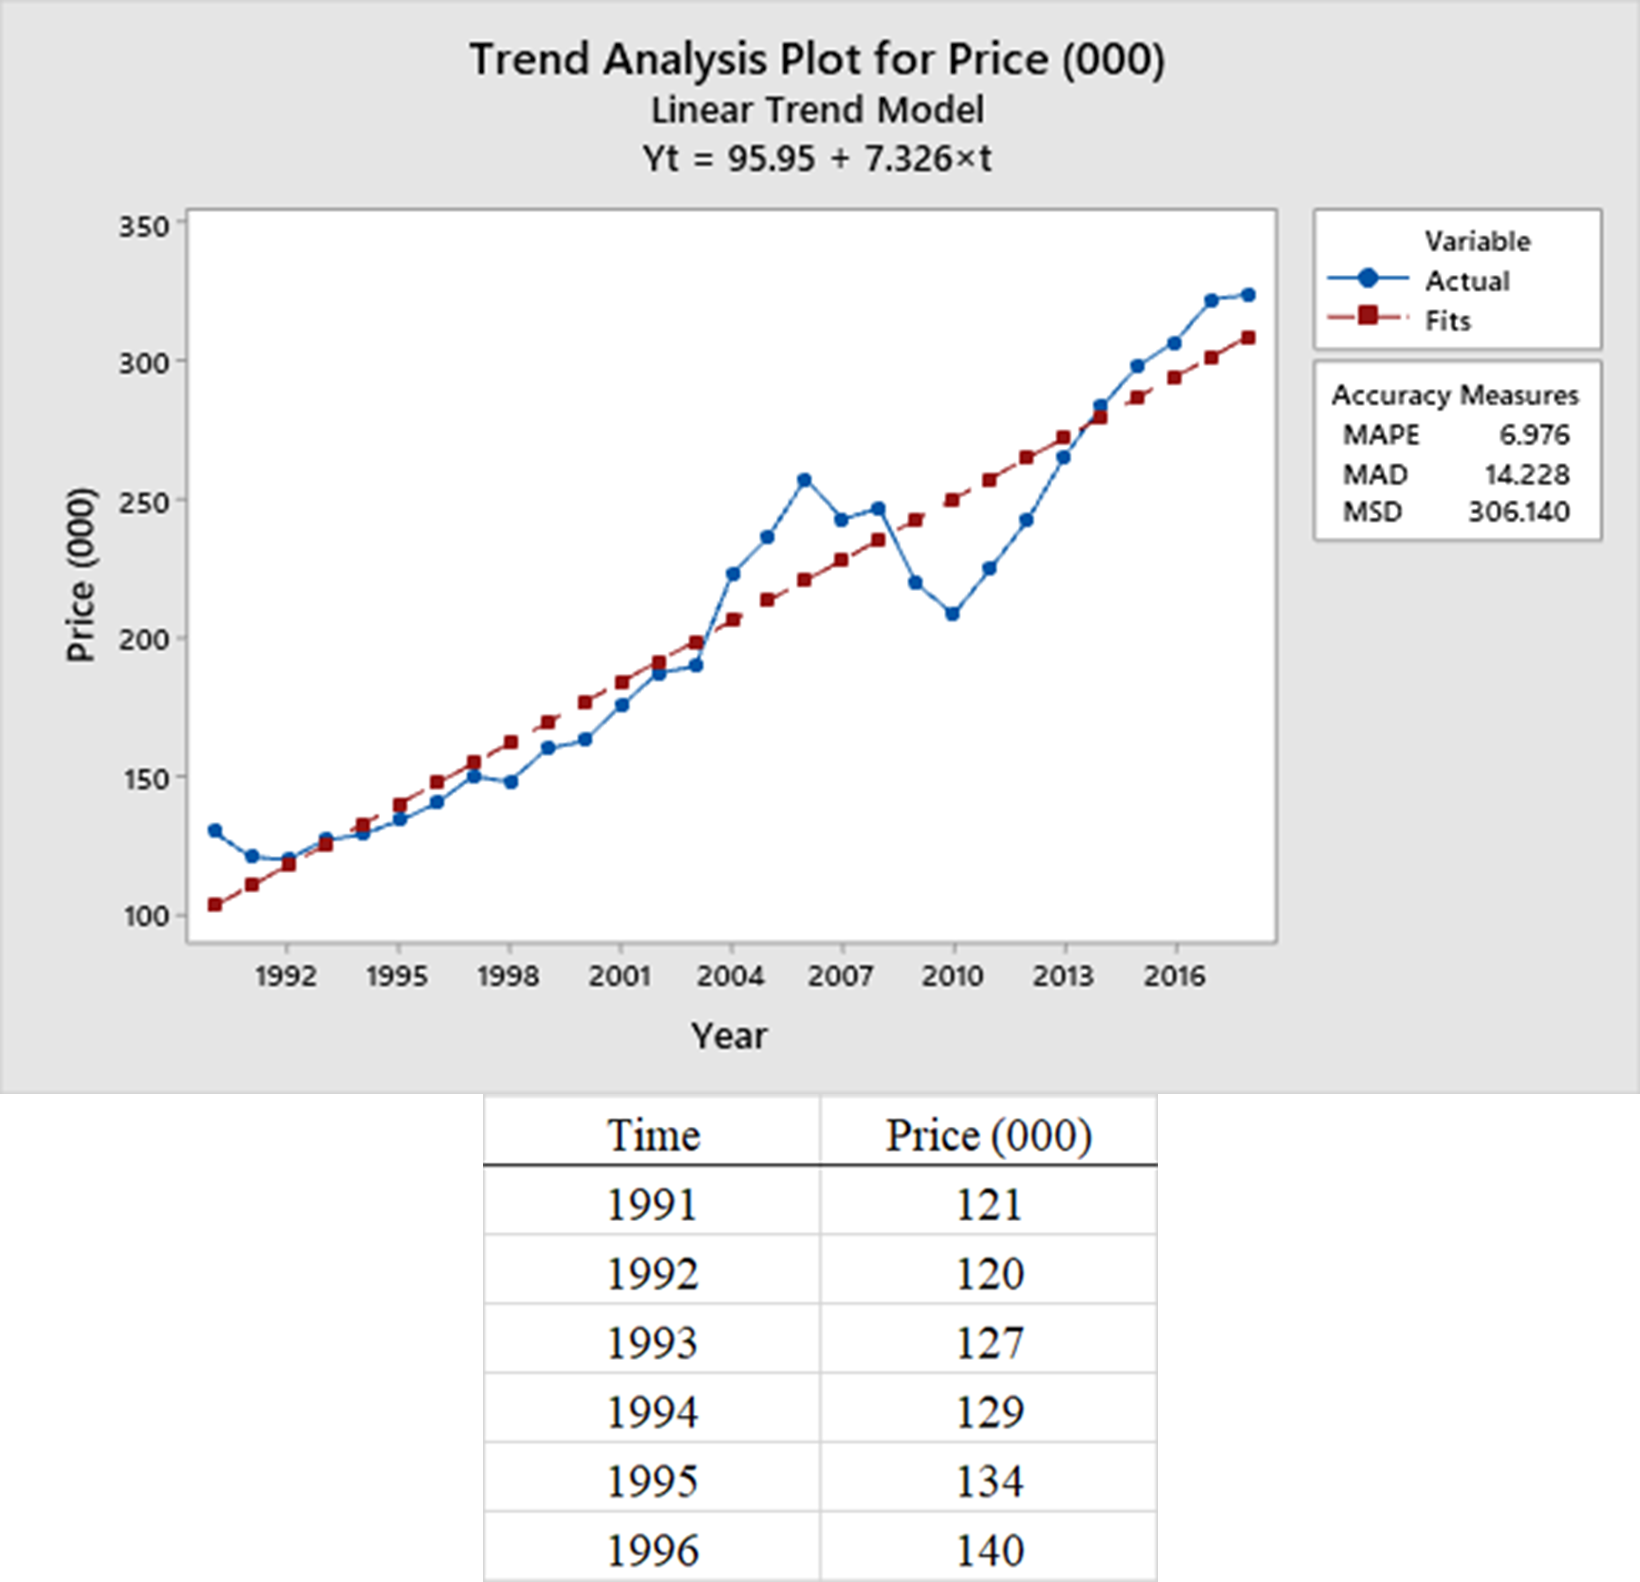
Also provided is the trend analysis output for a time series recording yearly median US Home Price $ from to Assume t for the year
Which gives the best forecast smaller absolute forecasting error of the median US Home Price? The corresponding year moving average, year moving average, the trend analysis, or the Nave forecasting method?
a What is the predicted value for the year moving average method? How about the absolute forecasting error? Show the work including the formula in detail.
b What is the predicted value for the year moving average method? How about the absolute forecasting error? Show the work including the formula in detail.
c What is the predicted value for trend analysis method? How about the absolute forecasting error? Show the work including the formula in detail.
d What is the predicted value for the Nave forecasting method? How about the absolute forecasting error? Show the work including the formula in detail.
e Which method is the best? Why?
Step by Step Solution
There are 3 Steps involved in it
1 Expert Approved Answer
Step: 1 Unlock

Question Has Been Solved by an Expert!
Get step-by-step solutions from verified subject matter experts
Step: 2 Unlock
Step: 3 Unlock