

Question: Data collected on the yearly registrations for a six sigma seminar at the quality college are shown in the following table: year: 1 2 3
Data collected on the yearly registrations for a six sigma seminar at the quality college are shown in the following table: year: 1 2 3 4 5 6 7 8 9 10 11 registrations: 4 6 4 5 10 8 7 9 12 14 15 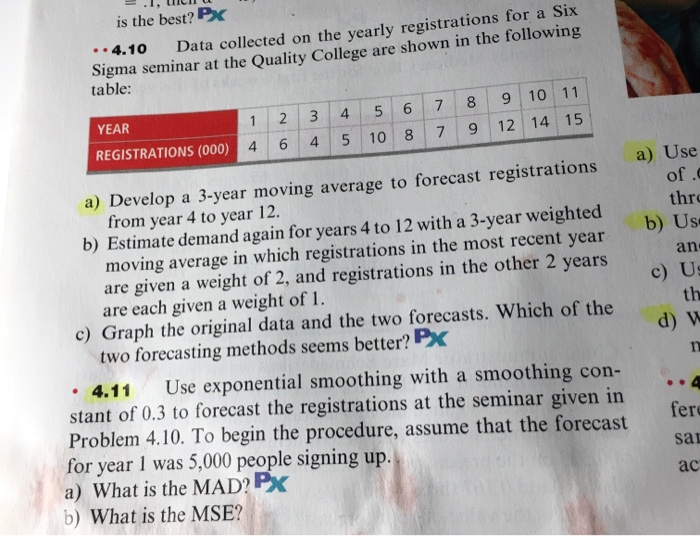
=.1, LCI is the best? PX .. 4.10 Data collected on the yearly registrations for a Six Sigma seminar at the Quality College are shown in the following table: 1 2 4 6 3 4 4 5 YEAR 6 8 5 10 7 8 7 9 9 10 11 12 14 15 REGISTRATIONS (000) a) Use of. thre b) Us: an c) U th d) w a) Develop a 3-year moving average to forecast registrations from year 4 to year 12. b) Estimate demand again for years 4 to 12 with a 3-year weighted moving average in which registrations in the most recent year are given a weight of 2, and registrations in the other 2 years are each given a weight of 1. c) Graph the original data and the two forecasts. Which of the two forecasting methods seems better? PX 4.11 Use exponential smoothing with a smoothing con- stant of 0.3 to forecast the registrations at the seminar given in Problem 4.10. To begin the procedure, assume that the forecast for year 1 was 5,000 people signing up. a) What is the MAD? PX b) What is the MSE? fer sa! ac use exponential smoothing with a smoothing constant of 0.3 to forecast the registrations at the seminar. to begin, use 5,000 people for year 1.
what is MAD
What is the MSE?
please work in excel
Step by Step Solution
There are 3 Steps involved in it
1 Expert Approved Answer
Step: 1 Unlock

Question Has Been Solved by an Expert!
Get step-by-step solutions from verified subject matter experts
Step: 2 Unlock
Step: 3 Unlock