

Question: Data collected on the yearly registrations for a Six Sigma seminar at the Quality College are shown in the following table: Year 1 2 3
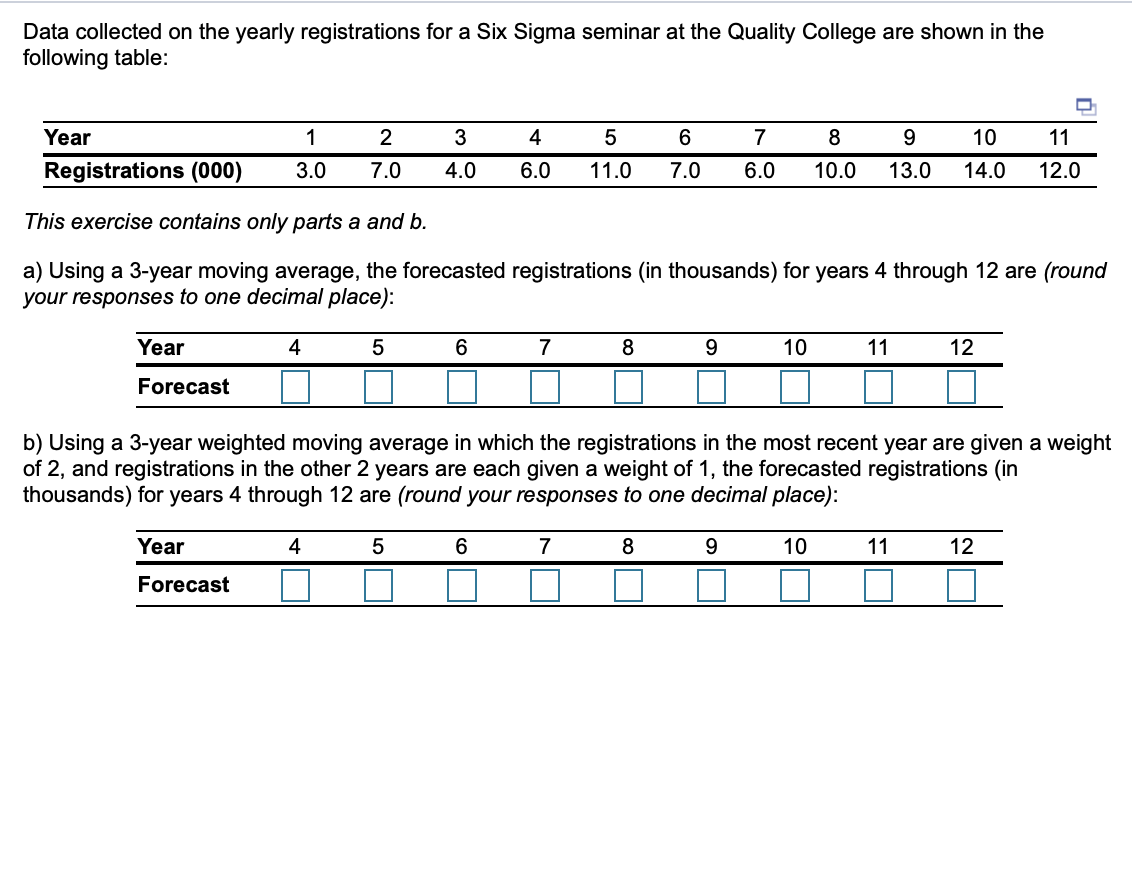
Data collected on the yearly registrations for a Six Sigma seminar at the Quality College are shown in the following table: Year 1 2 3 4 5 6 7 8 9 10 11 Registrations (000) 3.0 7.0 4.0 6.0 11.0 7.0 6.0 10.0 13.0 14.0 12.0 This exercise contains only parts a and b. a) Using a 3-year moving average, the forecasted registrations (in thousands) for years 4 through 12 are (round your responses to one decimal place): Year 4 5 6 7 8 9 10 11 12 Forecast nothing nothing nothing nothing nothing nothing nothing nothing nothing b) Using a 3-year weighted moving average in which the registrations in the most recent year are given a weight of 2, and registrations in the other 2 years are each given a weight of 1, the forecasted registrations (in thousands) for years 4 through 12 are (round your responses to one decimal place): Year 4 5 6 7 8 9 10 11 12 Forecast nothing nothing nothing nothing nothing nothing nothing nothing nothing
Step by Step Solution
There are 3 Steps involved in it

Get step-by-step solutions from verified subject matter experts