

Question: Data Collection Use the data set you collected for the Week 5 lab (heights of 10 different people plus the 10 heights provided by your
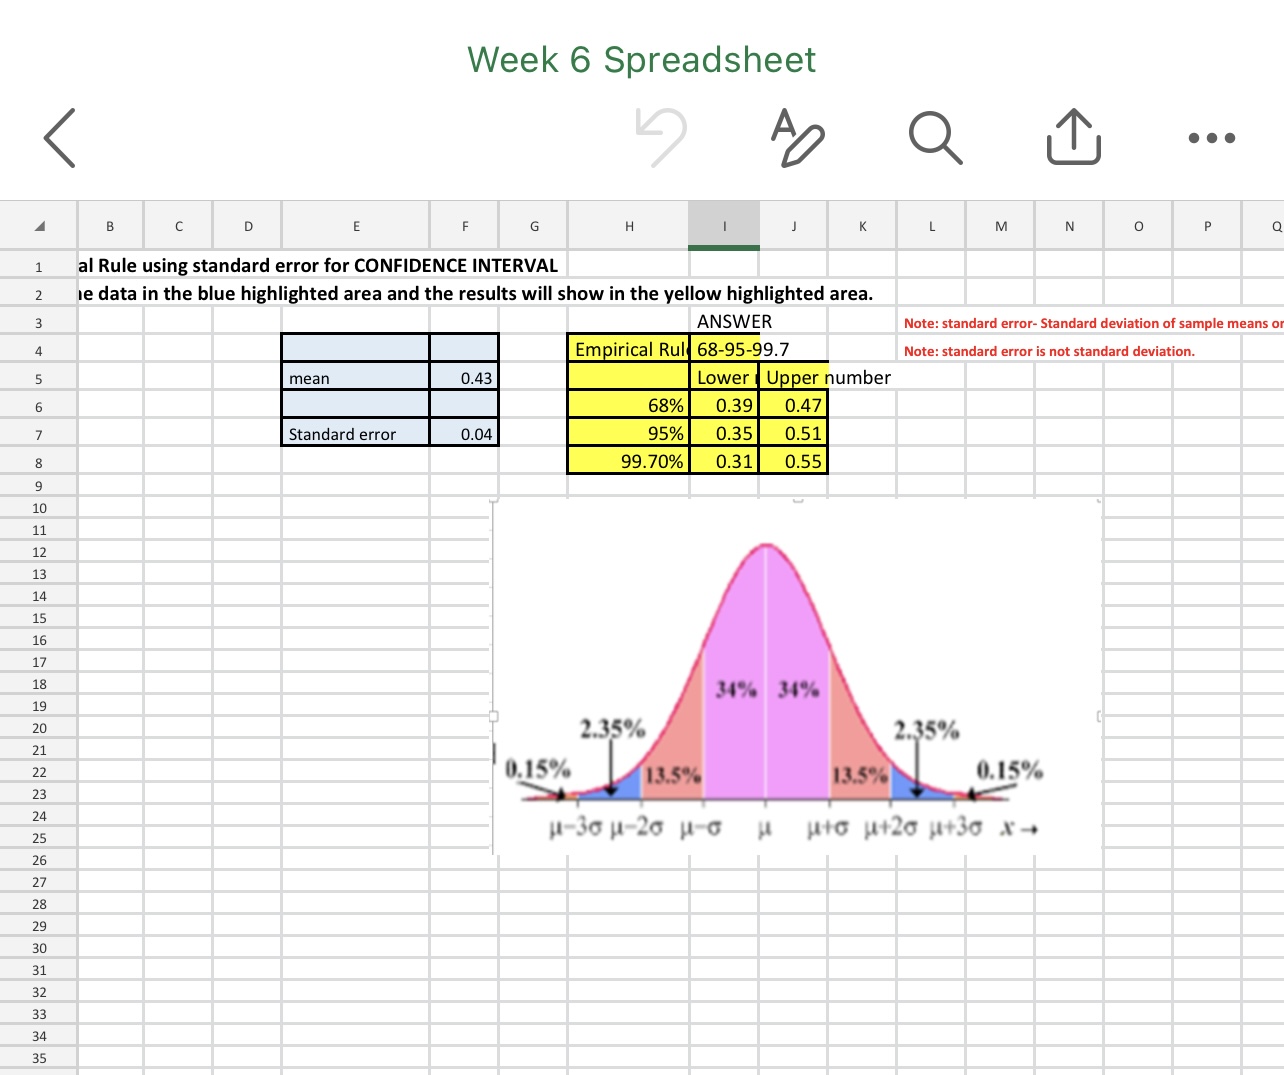
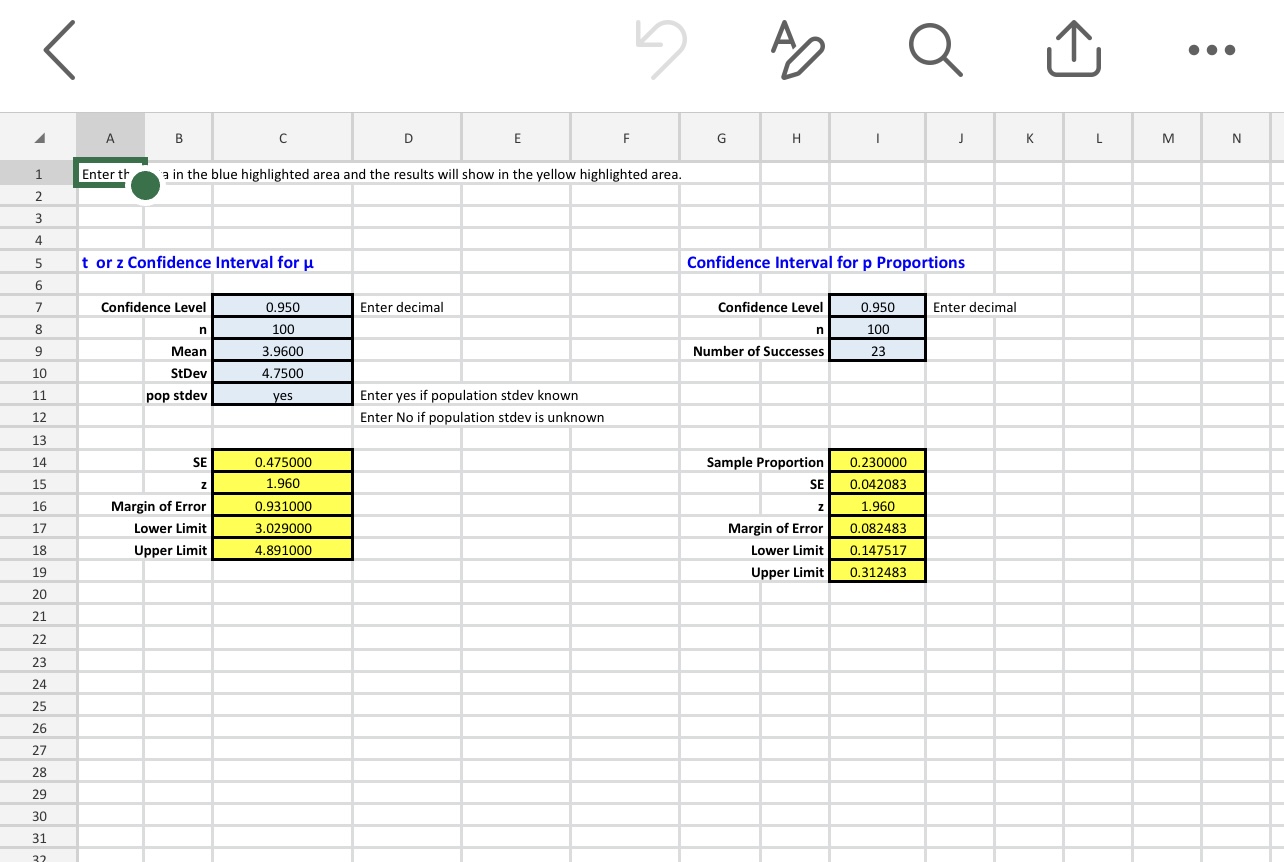
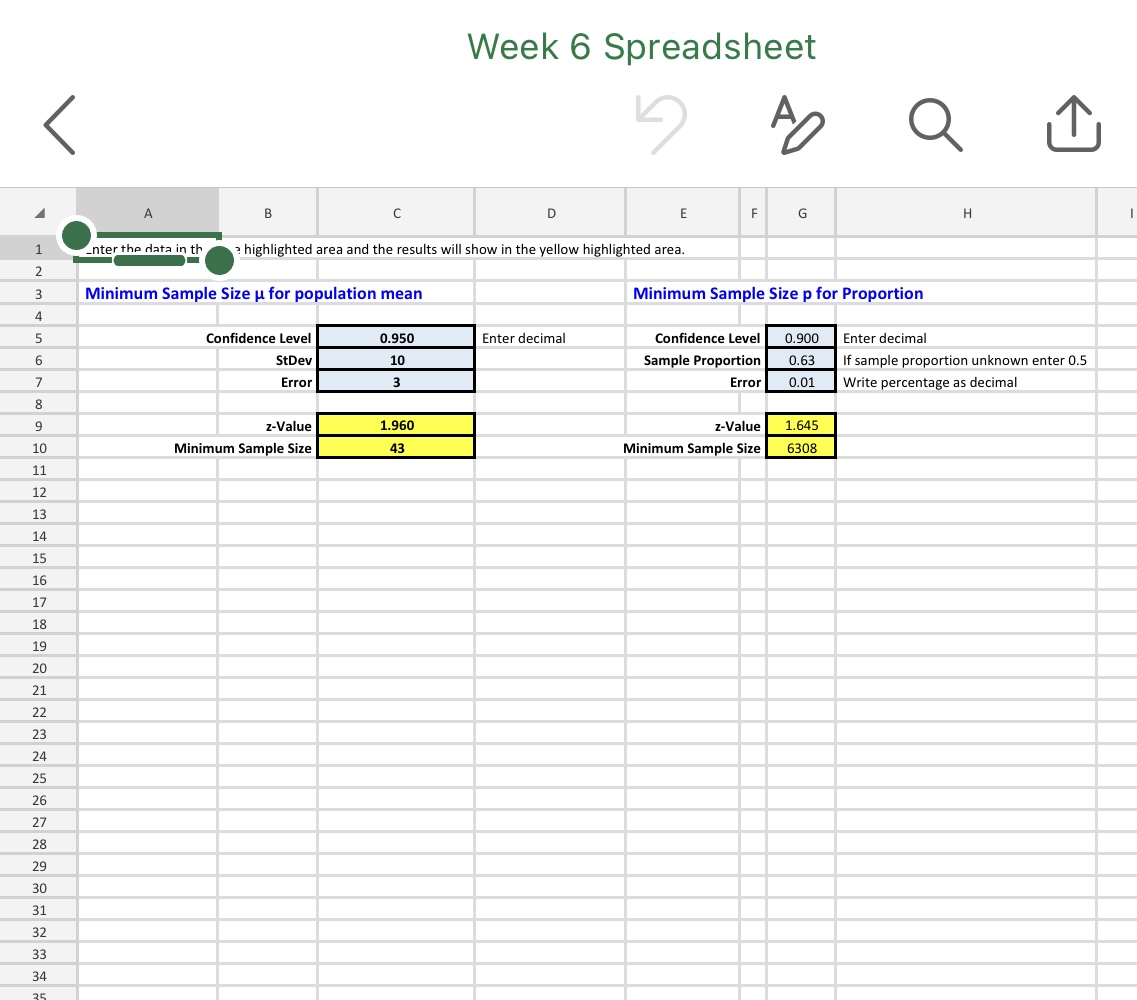
Data Collection Use the data set you collected for the Week 5 lab (heights of 10 different people plus the 10 heights provided by your instructor). (NOTE: This is NOT the data used in the lab video, which is about midterm grades. Do not use the midterm grades data.) Provide a screenshot of your Week 5 Data (20 Heights) Instructor: 59,63,65,66,67,68,68,69,70,70 Mine: 64,70,66,75,69,68,74,72,71,67 Summarize the Preliminary Calculations (Round to 2 decimal places): Sample Mean: 68.05 Standard Deviation: 3.73 Your Height: 62 Please answer the following questions in complete sentences: 1. Discuss your method of collection for the values that you are using in your study (systematic, convenience, cluster, stratified, simple random). For our study on height distribution, participants were selected using a convenience sampling method. This method was chosen for its practicality, allowing us to easily access and collect data from individuals who were readily available and willing to participate. 2. What are some faults with this type of data collection? 3. What other types of data collection could you have used, and how might this have affected your study? Calculation of 95% Confidence Interval 1. Give a point estimate (mean) for the average height of all people at the place where you work. What is your point estimate, and what does this mean? 2. Find a 95% confidence interval for the true mean of heights. What is the interval? [Provide a Screenshot of your work from the t value Confidence Interval for p from the Confidence Interval tab on the Week 6 Excel spreadsheet] 3. Give a practical interpretation of the 95% confidence interval [Write a complete sentence]. Calculation of 99% Confidence Interval Now, change your confidence level to 99% for the same data. 1. Find a 99% confidence interval for the true mean of heights. What is the interval? [Provide a Screenshot of your work from the t value Confidence Interval for p from the Confidence Interval tab on the Week 6 Excel spreadsheet] 2. Give a practical interpretation of the 99% confidence interval [Write a complete sentence]. Week 6 Spreadsheet A AD Q T . . . B D G H K M N al Rule using standard error for CONFIDENCE INTERVAL 2 le data in the blue highlighted area and the results will show in the yellow highlighted area. 3 ANSWER Note: standard error- Standard deviation of sample means o Empirical Rul 68-95-99.7 Note: standard error is not standard deviation. mean 0.43 Lower | Upper number 68% 0.39 0.47 Standard error 0.04 ).35 0.51 99.70% 0.31 0.55 34% 34% 2.35% 2.35% 0.15% 13.5% 13.5% 0.15% H-30 -20 H-G u HG H1+20 11+30 X4W N h W N By WA R R RS R RS R R P R R e e e e e e O WL e o ;e W N R DD N W N o oW & B = D E E A I Enter tl".a in the blue highlighted area and the results will show in the yellow highlighted area. t or z Confidence Interval for p Confidence Level Enter decimal Mean StDev pop stdev \" Enter yes if population stdev known Enter No if population stdev is unknown SE 0.475000 z Margin of Error Lower Limit 3.029000 Upper Limit Confidence Interval for p Proportions Confidence Level 0.950 Enter decimal n Number of Successes Sample Proportion SE z Margin of Error Lower Limit Upper Limit 0.230000 0.042083 0.082483 0.147517 0.312483 Week 6 Spreadsheet AD B D E F G H enter the data in th highlighted area and the results will show in the yellow highlighted area. Minimum Sample Size u for population mean Minimum Sample Size p for Proportion LD CO V G U P W N H Confidence Level 0.950 Enter decimal Confidence Level 0.900 Enter decimal StDev 10 Sample Proportion 0.63 If sample proportion unknown enter 0.5 Error 3 Error 0.01 Write percentage as decimal z-Value 1.960 z-Value 1.645 10 Minimum Sample Size 43 Minimum Sample Size 6308 11 12 13 14 15 16 17 18 19 20 21 22 23 24 25 26 27 28 29 30 31 32 33 34
Step by Step Solution
There are 3 Steps involved in it

Get step-by-step solutions from verified subject matter experts