

Question: data collectod Table 1 . acetone chloform 2 . Plot the temperature values versus mole fraction. Draw a smooth curve through the distillate points V
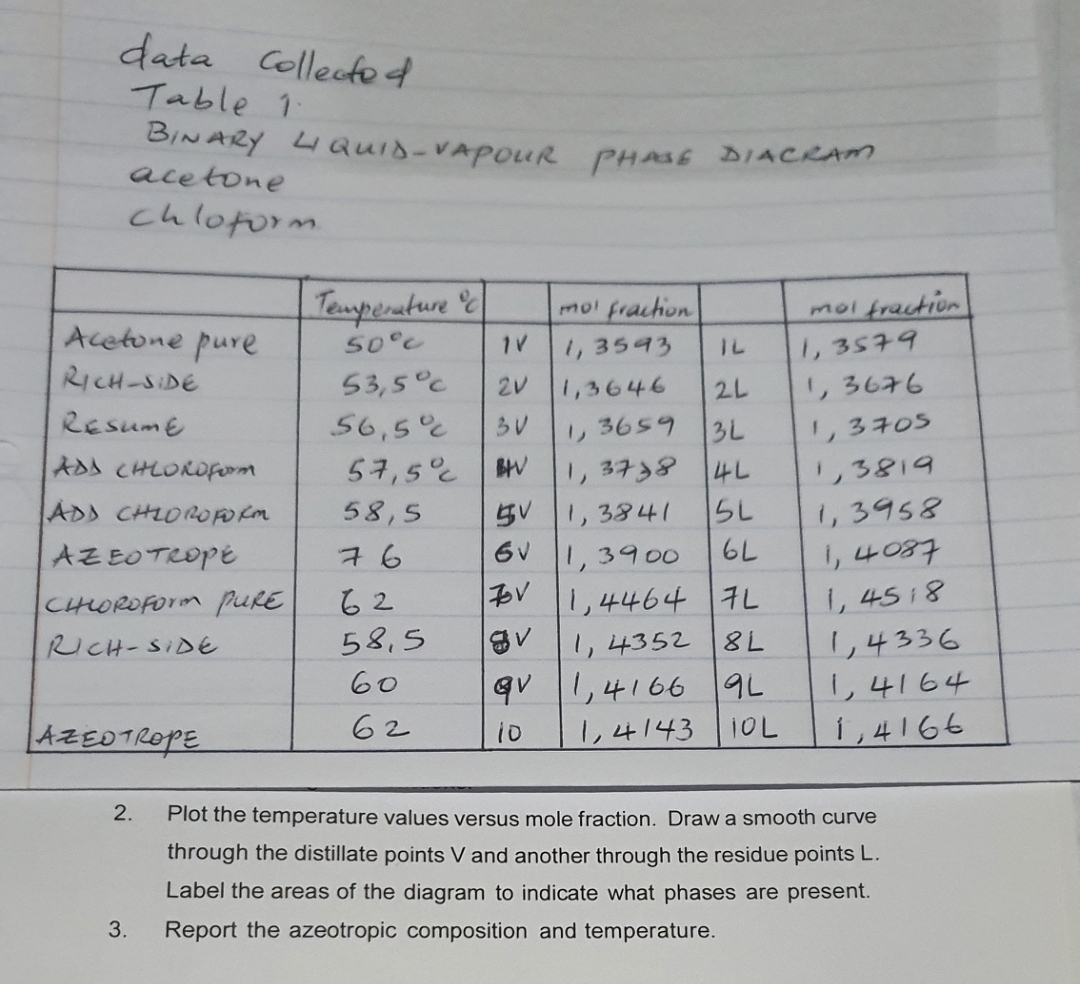
data collectod
Table
acetone
chloform
Plot the temperature values versus mole fraction. Draw a smooth curve through the distillate points and another through the residue points
Label the areas of the diagram to indicate what phases are present.
Report the azeotropic composition and temperature.
Step by Step Solution
There are 3 Steps involved in it
1 Expert Approved Answer
Step: 1 Unlock

Question Has Been Solved by an Expert!
Get step-by-step solutions from verified subject matter experts
Step: 2 Unlock
Step: 3 Unlock