

Question: Data for a project are given in the table below. Efficiency, Preliminary Efficiency, Normal Time to Completion, Minimum Time to Completion, Cost for Normal Time
Data for a project are given in the table below.
Efficiency, Preliminary Efficiency, Normal Time to Completion, Minimum Time to Completion, Cost for Normal Time (CU million), cost for minimum time (million) 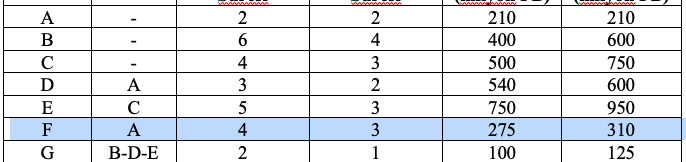
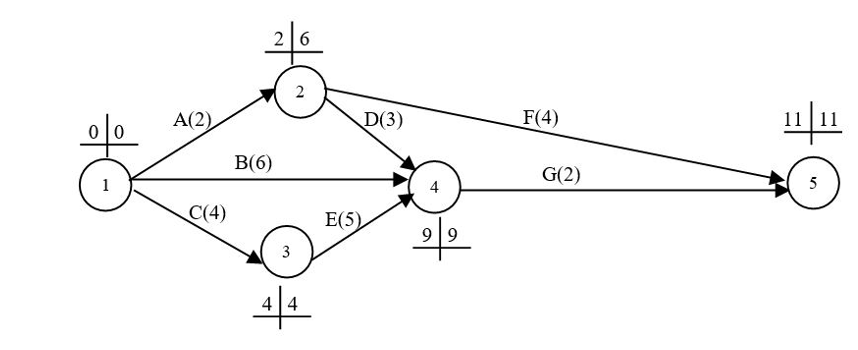
The network diagram of this project was drawn and the early/late times of the nodes were found with the CPM method. The resulting situation is as follows:
For the project in question, do the following:
a) Calculate the total abundances for each activity. b) Identify the critical path. c) What is the cost of completing the project in 7 days?
\begin{tabular}{|c|c|c|c|c|c|} \hline A & & 2 & 2 & 210 & 210 \\ \hline B & & 6 & 4 & 400 & 600 \\ \hline C & & 4 & 3 & 500 & 750 \\ \hline D & A & 3 & 2 & 540 & 600 \\ \hline E & C & 5 & 3 & 750 & 950 \\ \hline F & A & 4 & 3 & 275 & 310 \\ \hline G & BDE & 2 & 1 & 100 & 125 \\ \hline \end{tabular}Step by Step Solution
There are 3 Steps involved in it
1 Expert Approved Answer
Step: 1 Unlock

Question Has Been Solved by an Expert!
Get step-by-step solutions from verified subject matter experts
Step: 2 Unlock
Step: 3 Unlock