

Question: Data for metabolic rate as a function of mass is provided below. It is believed that the data follows the power relationship, ie, metabolism-? mass
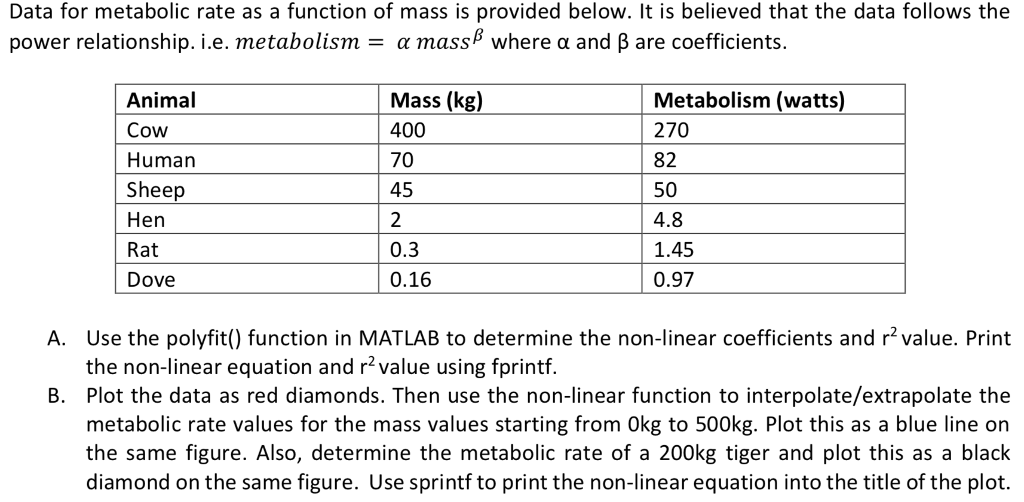
Data for metabolic rate as a function of mass is provided below. It is believed that the data follows the power relationship, ie, metabolism-? mass where ? and ? are coefficients. Animal Cow Human Sheep Hen Rat Dove Mass (kg) 400 70 45 Metabolism (watts) 270 82 50 4.8 1.45 0.97 0.3 0.16 Use the polyfit() function in MATLAB to determine the non-linear coefficients and r2 value. Print the non-linear equation and r value using fprintf Plot the data as red diamonds. Then use the non-linear function to interpolate/extrapolate the metabolic rate values for the mass values starting from Okg to 500kg. Plot this as a blue line on the same figure. Also, determine the metabolic rate of a 200kg tiger and plot this as a black diamond on the same figure. Use sprintf to print the non-linear equation into the title of the plot. A. B
Step by Step Solution
There are 3 Steps involved in it

Get step-by-step solutions from verified subject matter experts