

Question: Data for Muscateer Designs, Inc. follow: Data Table (Click the icon to view the data.) Read the requirements Requirement 1. Prepare a comparative common-size income
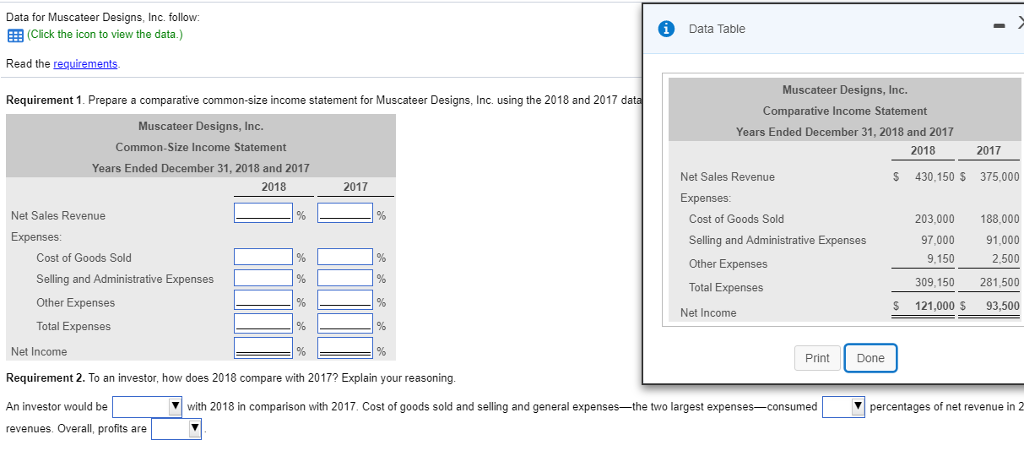
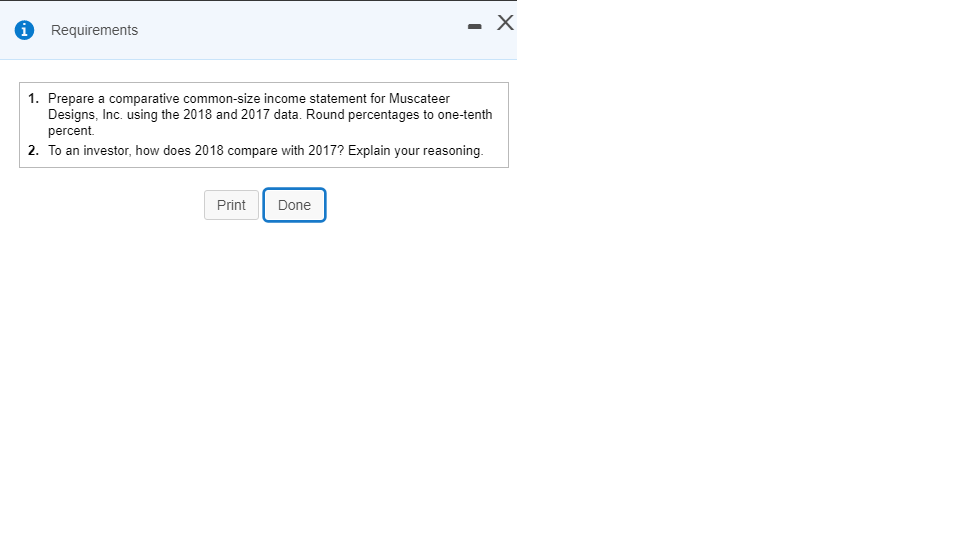
Data for Muscateer Designs, Inc. follow: Data Table (Click the icon to view the data.) Read the requirements Requirement 1. Prepare a comparative common-size income statement for Muscateer Designs, Inc. using the 2018 and 2017 d Muscateer Designs, Inc. Comparative Income Statement Years Ended December 31, 2018 and 2017 Muscateer Designs, Inc. Common Size Income Statement Years Ended December 31, 2018 and 2017 2018 2017 Net Sales Revenue S 430.150 $ 375,000 2018 2017 Net Sales Revenue Cost of Goods Sold Selling and Administrative Expenses Other Expenses Total Expenses 203.000 188,000 91,000 2.500 309,150 281,500 S 121,000 $ 93,500 Expenses 97,000 9,150 Cost of Goods Sold Selling and Administrative Expenses Other Expenses Total Expenses | | % | | % Net Income Net Income Requirement 2. To an investor, how does 2018 compare with 2017? Explain your reasoning An investor would be revenues. Overall, profits are Print Done | with 2018 in Comparison with 2017 Cost of goods sold and selling and general expenses-the two largest expenses-consumed Vpercentages of net revenue in 2
Step by Step Solution
There are 3 Steps involved in it

Get step-by-step solutions from verified subject matter experts