

Question: s17-13 please show your work E17-13 (similar to) Quesion Help Data for Muscateer Designs, Inc. follow (Click the icon to view the data.) Read the
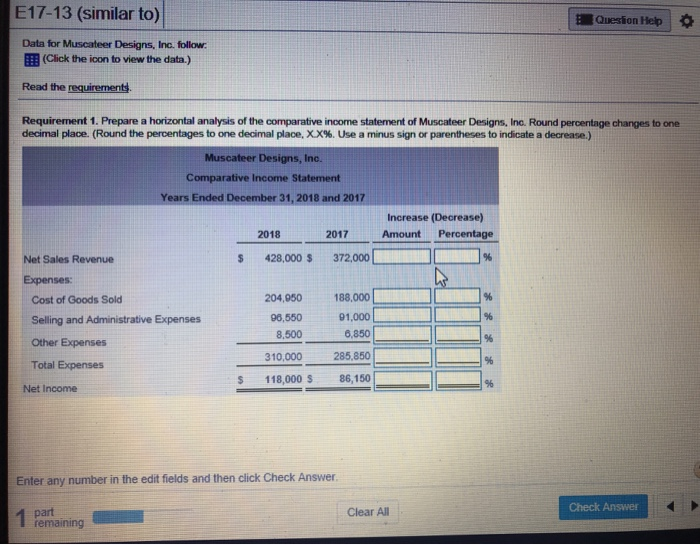
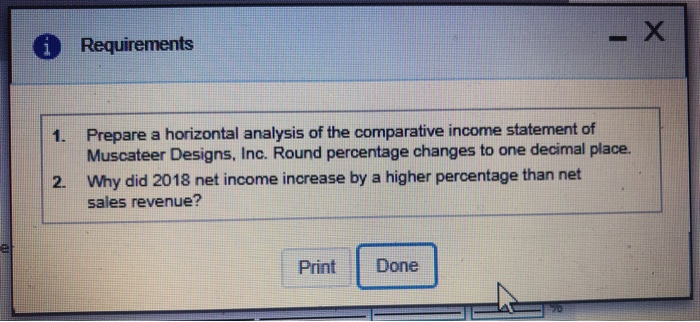
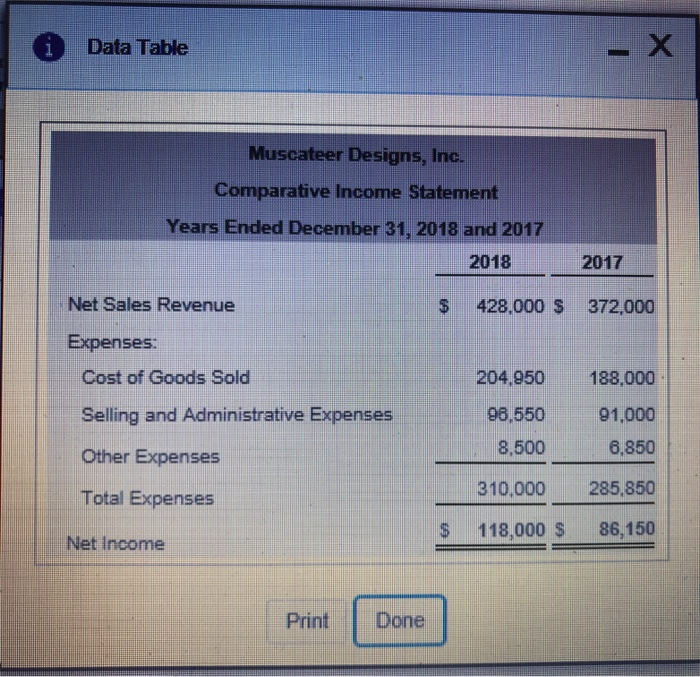
E17-13 (similar to) Quesion Help Data for Muscateer Designs, Inc. follow (Click the icon to view the data.) Read the requirements. Requirement 1. Prepare a horizontal analysis of the comparative income statement of Muscateer Designs, Inc. Round percentage changes to one decimal place. (Round the percentages to one decimal place, XX %. Use a minus sign or parentheses to indicate a decrease.) Muscateer Designs, Inc. Comparative Income Statement Years Ended December 31, 2018 and 2017 Increase (Decrease) Percentage 2018 2017 Amount S 428,000 $ 372,000 Net Sales Revenue Expenses: 188,000 % 204,050 Cost of Goods Sold 91,000 Selling and Administrative Expenses 96,550 6,850 8,500 Other Expenses 285,850 310,000 Total Expenses 118,000 S 86,150 S Net Income Enter any number in the edit fields and then click Check Answer. Check Answer part remaining Clear All 1 X Requirements Prepare a horizontal analysis of the comparative income statement of Muscateer Designs, Inc. Round percentage changes to one decimal place. 1. Why did 2018 net income increase by a higher percentage than net sales revenue? 2. Done Print - X Data Table Muscateer Designs, Inc. Comparative Income Statement Years Ended December 31, 2018 and 2017 2018 2017 Net Sales Revenue 428,000 S 372,000 $ Expenses: Cost of Goods Sold 204,950 188,000 Selling and Administrative Expenses 96,550 91,000 6.850 8,500 Other Expenses 285,850 310,000 Total Expenses 86,150 118,000 S $ Net Income Done Print
Step by Step Solution
There are 3 Steps involved in it

Get step-by-step solutions from verified subject matter experts