

Question: Data: Hours worked : 55 15 12 15 22 28 36 46 42 40 25 54 39 41 50 42 43 60 28 41 42
Data:
Hours worked : 55 15 12 15 22 28 36 46 42 40 25 54 39 41 50 42 43 60 28 41 42 50 46 46 35 45 60 10 9 48 40 50 60 55 25 45 40 43 6 60 80 50 46 46 35 45 60 10 9 48 40 50 60 55 25 45 40 43 6 60 80 9 45 45 50 35 10 48 43 55 80 10 41 45 42 44 80 50 50 46 46 35 45 60 10 9 48 40 50 60 55 25 45 40 43 6 60 80 9 45 45 50 35 10 48 43 55 80 10 41 45 42 44 80 50 21 50 55 50 52 50 40 70 60 45 50 54 45 48 50 50 64 45 44.4 78 48 130 60 50 60 56 50 82 50 42 24 54 60 40 40 40 50 78 45 48 45 60 53 48 53 43 48 40 40 37 25 20 52 45 40 40 40 40 50 50 80 40 50 40 50 15 36 55 60 44 60 42 50 80 90 40 50
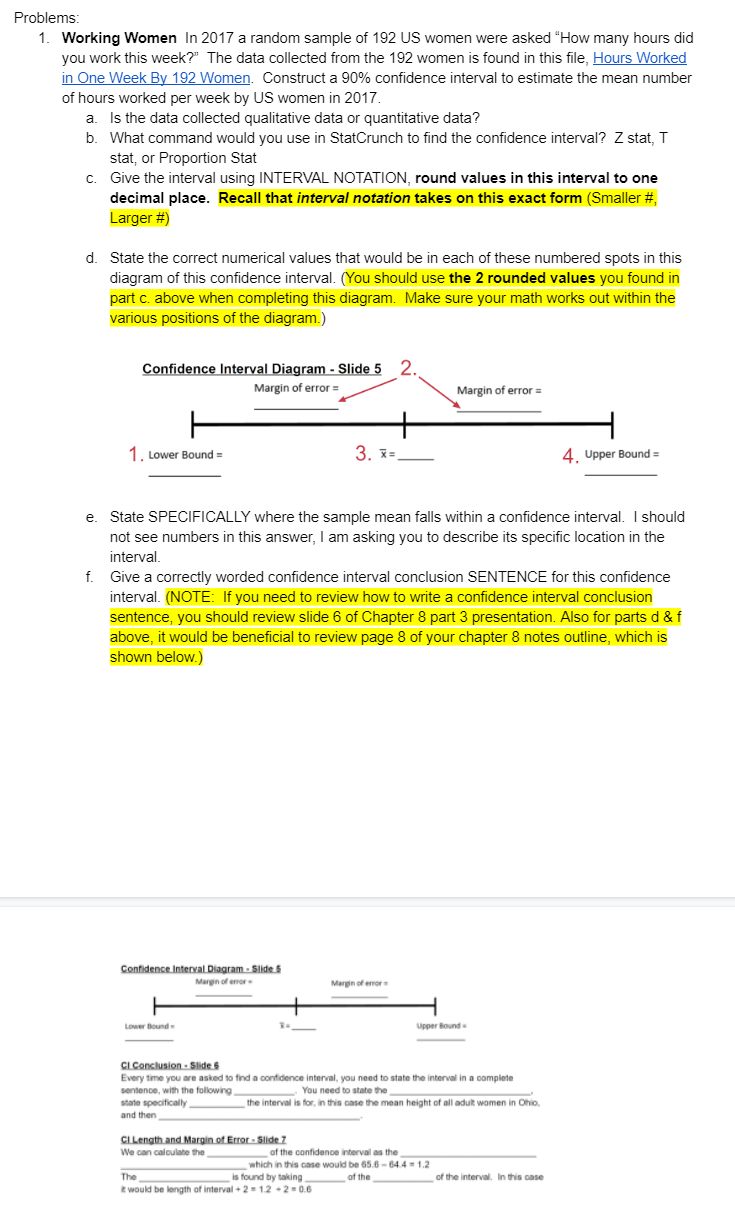
Problems: 1. Working Women In 2017 a random sample of 192 US women were asked How many hours did you work this week?" The data collected from the 192 women is found in this file, Hours Worked in One Week By 192 Women. Construct a 90% confidence interval to estimate the mean number of hours worked per week by US women in 2017. a. Is the data collected qualitative data or quantitative data? b. What command would you use in StatCrunch to find the confidence interval? Z stat, T stat, or Proportion Stat Give the interval using INTERVAL NOTATION, round values in this interval to one decimal place. Recall that interval notation takes on this exact form (Smaller #, Larger #) . d. State the correct numerical values that would be in each of these numbered spots in this diagram of this confidence interval. (You should use the 2 rounded values you found in part c. above when completing this diagram. Make sure your math works out within the various positions of the diagram.) 2. Confidence Interval Diagram - Slide 5 Margin of error = Margin of error = 1. Lower Bound - 3. * 4. Upper Bound e. State SPECIFICALLY where the sample mean falls within a confidence interval. I should not see numbers in this answer, I am asking you to describe its specific location in the interval. f. Give a correctly worded confidence interval conclusion SENTENCE for this confidence interval. (NOTE: If you need to review how to write a confidence interval conclusion sentence, you should review slide 6 of Chapter 8 part 3 presentation. Also for parts d&f above, it would be beneficial to review page 8 of your chapter 8 notes outline, which is shown below.) Confidence Interval Diagram - Slide 5 Margin of error Margin of Lower bound Upper Bound CI Conclusion Slides Every time you are asked to find a confidence interval, you need to state the interval in a complete sentence with the following You need to state the state specifically the interval is for in this case the mean height of all adut women in Ohio. , . and then ClLength and Margin of Error - Slide 7 We can calculate the of the confidence interval as the which in this case would be 65.6 - 64.4 - 1.2 The is found by taking of the of the interval. In this case would be length of interval+212 +2 -0.6 Problems: 1. Working Women In 2017 a random sample of 192 US women were asked How many hours did you work this week?" The data collected from the 192 women is found in this file, Hours Worked in One Week By 192 Women. Construct a 90% confidence interval to estimate the mean number of hours worked per week by US women in 2017. a. Is the data collected qualitative data or quantitative data? b. What command would you use in StatCrunch to find the confidence interval? Z stat, T stat, or Proportion Stat Give the interval using INTERVAL NOTATION, round values in this interval to one decimal place. Recall that interval notation takes on this exact form (Smaller #, Larger #) . d. State the correct numerical values that would be in each of these numbered spots in this diagram of this confidence interval. (You should use the 2 rounded values you found in part c. above when completing this diagram. Make sure your math works out within the various positions of the diagram.) 2. Confidence Interval Diagram - Slide 5 Margin of error = Margin of error = 1. Lower Bound - 3. * 4. Upper Bound e. State SPECIFICALLY where the sample mean falls within a confidence interval. I should not see numbers in this answer, I am asking you to describe its specific location in the interval. f. Give a correctly worded confidence interval conclusion SENTENCE for this confidence interval. (NOTE: If you need to review how to write a confidence interval conclusion sentence, you should review slide 6 of Chapter 8 part 3 presentation. Also for parts d&f above, it would be beneficial to review page 8 of your chapter 8 notes outline, which is shown below.) Confidence Interval Diagram - Slide 5 Margin of error Margin of Lower bound Upper Bound CI Conclusion Slides Every time you are asked to find a confidence interval, you need to state the interval in a complete sentence with the following You need to state the state specifically the interval is for in this case the mean height of all adut women in Ohio. , . and then ClLength and Margin of Error - Slide 7 We can calculate the of the confidence interval as the which in this case would be 65.6 - 64.4 - 1.2 The is found by taking of the of the interval. In this case would be length of interval+212 +2 -0.6Step by Step Solution
There are 3 Steps involved in it
1 Expert Approved Answer
Step: 1 Unlock

Question Has Been Solved by an Expert!
Get step-by-step solutions from verified subject matter experts
Step: 2 Unlock
Step: 3 Unlock