

Question: data: https://drive.google.com/file/d/1QO2WM3CZmgakxRanuwyMg_uJsVA6AP3v/view?usp=sharing Question 7 1 pts Download the file assignment7QQplotq3.csy @ (comma separated text file) and read the data into R. Then create a Q-Q
data: https://drive.google.com/file/d/1QO2WM3CZmgakxRanuwyMg_uJsVA6AP3v/view?usp=sharing
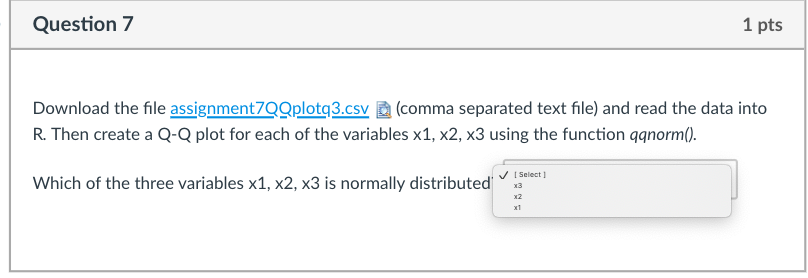
Question 7 1 pts Download the file assignment7QQplotq3.csy @ (comma separated text file) and read the data into R. Then create a Q-Q plot for each of the variables x1, x2, x3 using the function qqnorm(). Which of the three variables x1, x2, x3 is normally distributed [ Select ] 13
Step by Step Solution
There are 3 Steps involved in it
1 Expert Approved Answer
Step: 1 Unlock

Question Has Been Solved by an Expert!
Get step-by-step solutions from verified subject matter experts
Step: 2 Unlock
Step: 3 Unlock