

Question: Kmeans python file import csv import numpy as np import matplotlib.pyplot as plt # Computes the distance between two data points def calc_distance(X1, X2): return(np.sum((X1
Kmeans python file
import csv
import numpy as np
import matplotlib.pyplot as plt
# Computes the distance between two data points
def calc_distance(X1, X2):
return(np.sum((X1 - X2)**2))**0.5
# Function to read data from the csv files
# Hint 1: Remember that CSV files are comma separated, so you should use a "," as a delimiter.
# Hint 2: Ensure you are reading the csv file in the correct mode.
def read_csv(filename):
with open(filename) as fh:
rd = csv.DictReader(fh, delimiter=',')
data =[]
for row in rd:
data.append(row)
values = [list(dictionary.values())[1:] for dictionary in data]
# Convert the data into float for processing
values = [list(map(float,value)) for value in values]
return values
# Define a function that finds the closest centroid to each point out of all the centroids
# Hint: This function should call the function you implemented that computes the distance between two data points.
# Hint: Numpy has a useful method that allows you to find the index of the smallest value in an array.
def closest_centroid(data,centroids):
# assign centroid to data points by using a dictionary with centroid index as key and its data points as value
assigned_centroid = {}
for j in range(len(centroids)):
assigned_centroid[j] = []
for i in data:
distance =[]
# calculate distance to all centroids
for j in centroids:
distance.append(calc_distance(np.array(i),np.array(j)))
# Use numpy argmin the usefull method to find index of smallest value in distance array which corresponds to index of centroid
assigned_centroid[np.argmin(distance)].append(i)
return assigned_centroid
#Make a function to visualise the clusters. (optional, but useful to see the changes and if your algorithm is working)
def plot_clusters(assign_data,centroids,iter):
plt.figure()
plt.scatter(np.array(centroids)[:, 0], np.array(centroids)[:, 1], color='black')
for i in range(len(centroids)):
plt.scatter(np.array(assign_data[i])[:,0],np.array(assign_data[i])[:,1],alpha = 0.2)
# plt.scatter(np.array(data)[:, 0], np.array(data)[:, 1], alpha=0.1)
plt.xlabel("Birth rate")
plt.ylabel("Life Expectancy")
plt.title(f"Centroids and clusters in iteration = {iter+1}")
plt.savefig(f"Cluster_{iter}.png")
print(f"Plot has been saved to Cluster_{iter}.png")
# plt.show()
# Make the initialisation procedure
# Dataset you want to analyse
filename = 'dataBoth.csv'
# Define number of clusters k
numClusters = 3
while True:
try:
numClusters = int(input("Please enter the number of Clusters "))
break
except ValueError:
print("Please enter a valid number of clusters")
# No of iterations
max_iter =6
while True:
try:
max_iter = int(input("Please enter the number of iterations "))
break
except ValueError:
print("Please enter a valid number of clusters")
# get data and initalize centroids
X = read_csv(filename)
centroids_idx = np.random.choice(len(X),numClusters)
centroids =[]
for idx in centroids_idx:
centroids.append(X[idx])
# Implement the k-means algorithm, using appropriate looping for the number of iterations
# --- find the closest centroid to each point and assign the point to that centroid's cluster
# --- calculate the new mean of all points in that cluster
# --- visualize (optional, but useful to see the changes)
#---- repeat
for i in range(max_iter):
# Closest centroid to each points
assign_centroids = closest_centroid(X,centroids)
# Calculate new mean and update centroids_idx
new_centroids =[np.mean(assign_centroids[centroid],axis=0) for centroid in assign_centroids.keys()]
# Visualize cluster for each iterations
plot_clusters(closest_centroid(X,new_centroids),new_centroids,i)
centroids = new_centroids
# ====
# Print out the results for questions
#1) The number of countries belonging to each cluster
#2) The list of countries belonging to each cluster
#3) The mean Life Expectancy and Birth Rate for each cluster
# Final Data and their clusters
final_cluster_data = closest_centroid(X,centroids)
# Print the required in the question
for i in range(len(centroids)):
print(f"Number of countries in cluster with centroid {centroids[i]} = {len(final_cluster_data[i])}")
# Get countries data
data =[]
with open(filename) as fh:
rd = csv.DictReader(fh, delimiter=',')
for row in rd:
data.append(list(row.values()))
for i in range(len(centroids)):
print(f" Countries in cluster with centroid {centroids[i]} ")
for j in final_cluster_data[i]:
country = [values[0] for values in data if values[1]==str(j[0]) and values[2] == str(j[1])]
if len(country)>0:
print(country[0])
for i in range(len(centroids)):
print(f"The mean Life Expectancy and Birth Rate for cluster with centroid {centroids[i]} = {round(np.mean(final_cluster_data[i],axis=0)[1],3)},{round(np.mean(final_cluster_data[i],axis=0)[0],3)}")
Datas
data 1 1953: https://docs.google.com/spreadsheets/d/1YwXeOPB_NGu3Eq7-TDmaeX4L-yGJYOq9C8TyQsrj_9s/edit?usp=sharing
data 2 2008: https://docs.google.com/spreadsheets/d/1USFlYnM0UkOHJTMwpSMu4g88bpsGWspGs7-WAIR2qMw/edit?usp=sharing
data both: https://docs.google.com/spreadsheets/d/1KjL1rdbrZIbKZQEfALRZ9-utJdI6V6GFVqfr6z7sNo4/edit?usp=sharing
To change the dataset, search for 'dataBoth.csv' and change the filename variable in the initialization section (on Line 58).
cluster 3 - centroids and clusters in iteration = 4
cluster 4 = centroids and clusters in iteration = 5
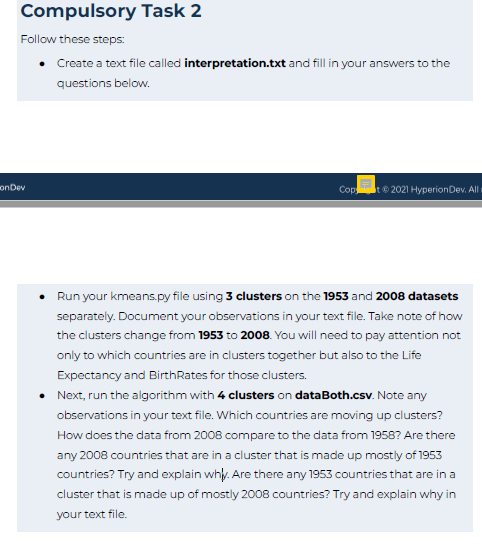
Compulsory Task 2 Follow these steps: - Create a text file called interpretation.txt and fill in your answers to the questions below. - Run your kmeans.py file using 3 clusters on the 1953 and 2008 datasets separately. Document your observations in your text file. Take note of how the clusters change from 1953 to 2008 . You will need to pay attention not only to which countries are in clusters together but also to the Life Expectancy and BirthRates for those clusters. - Next, run the algorithm with 4 clusters on dataBoth.csv. Note any observations in your text file. Which countries are moving up clusters? How does the data from 2008 compare to the data from 1958 ? Are there any 2008 countries that are in a cluster that is made up mostly of 1953 countries? Try and explain why. Are there any 1953 countries that are in a cluster that is made up of mostly 2008 countries? Try and explain why in your text file
Step by Step Solution
There are 3 Steps involved in it

Get step-by-step solutions from verified subject matter experts