

Question: Data in the table below summarize results from a series of experiments designed to explore how the factors XI (10, 15, or 20), X2 (1.5
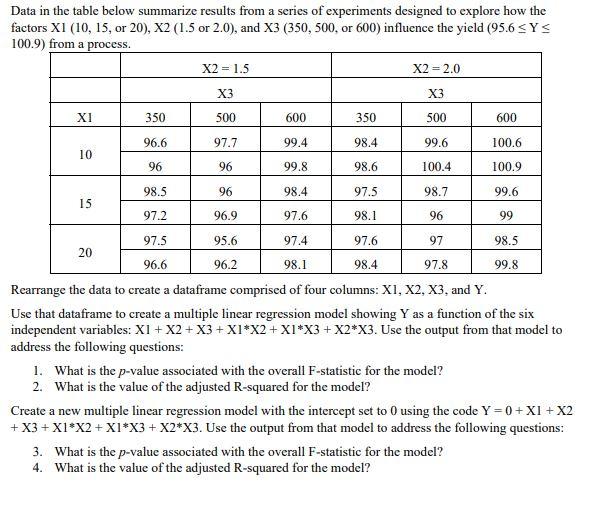
Data in the table below summarize results from a series of experiments designed to explore how the factors XI (10, 15, or 20), X2 (1.5 or 2.0), and X3 (350, 500, or 600) influence the yield (95.6 SYS 100.9) from a process X2 = 1.5 X2 = 2.0 X3 X3 XI 350 500 600 350 500 600 96.6 97.7 99.4 98.4 99.6 100.6 10 96 96 99.8 98.6 100.4 100.9 98.5 96 98.4 97.5 98.7 99.6 15 97.2 96.9 97.6 98.1 96 99 97.5 95.6 97.4 97.6 97 98.5 20 96.2 98.1 98.4 97.8 99.8 96.6 Rearrange the data to create a dataframe comprised of four columns: X1, X2, X3. and Y. Use that dataframe to create a multiple linear regression model showing Y as a function of the six independent variables: XI + x2 + x3 + XI*X2 + X1*X3 + X2*X3. Use the output from that model to address the following questions: 1. What is the p-value associated with the overall F-statistic for the model? 2. What is the value of the adjusted R-squared for the model? Create a new multiple linear regression model with the intercept set to O using the code Y = 0 + X1 + X2 + X3 + X1*X2 + X1*X3 + X2*X3. Use the output from that model to address the following questions: 3. What is the p-value associated with the overall F-statistic for the model? 4. What is the value of the adjusted R-squared for the model? Data in the table below summarize results from a series of experiments designed to explore how the factors XI (10, 15, or 20), X2 (1.5 or 2.0), and X3 (350, 500, or 600) influence the yield (95.6 SYS 100.9) from a process X2 = 1.5 X2 = 2.0 X3 X3 XI 350 500 600 350 500 600 96.6 97.7 99.4 98.4 99.6 100.6 10 96 96 99.8 98.6 100.4 100.9 98.5 96 98.4 97.5 98.7 99.6 15 97.2 96.9 97.6 98.1 96 99 97.5 95.6 97.4 97.6 97 98.5 20 96.2 98.1 98.4 97.8 99.8 96.6 Rearrange the data to create a dataframe comprised of four columns: X1, X2, X3. and Y. Use that dataframe to create a multiple linear regression model showing Y as a function of the six independent variables: XI + x2 + x3 + XI*X2 + X1*X3 + X2*X3. Use the output from that model to address the following questions: 1. What is the p-value associated with the overall F-statistic for the model? 2. What is the value of the adjusted R-squared for the model? Create a new multiple linear regression model with the intercept set to O using the code Y = 0 + X1 + X2 + X3 + X1*X2 + X1*X3 + X2*X3. Use the output from that model to address the following questions: 3. What is the p-value associated with the overall F-statistic for the model? 4. What is the value of the adjusted R-squared for the model
Step by Step Solution
There are 3 Steps involved in it

Get step-by-step solutions from verified subject matter experts