

Question: Data Inputs: Unit sales Selling price per unit Variable expense per unit Total fixed expenses $ $ $ 40,000 12.50 7.50 180,000 % Contribution Format
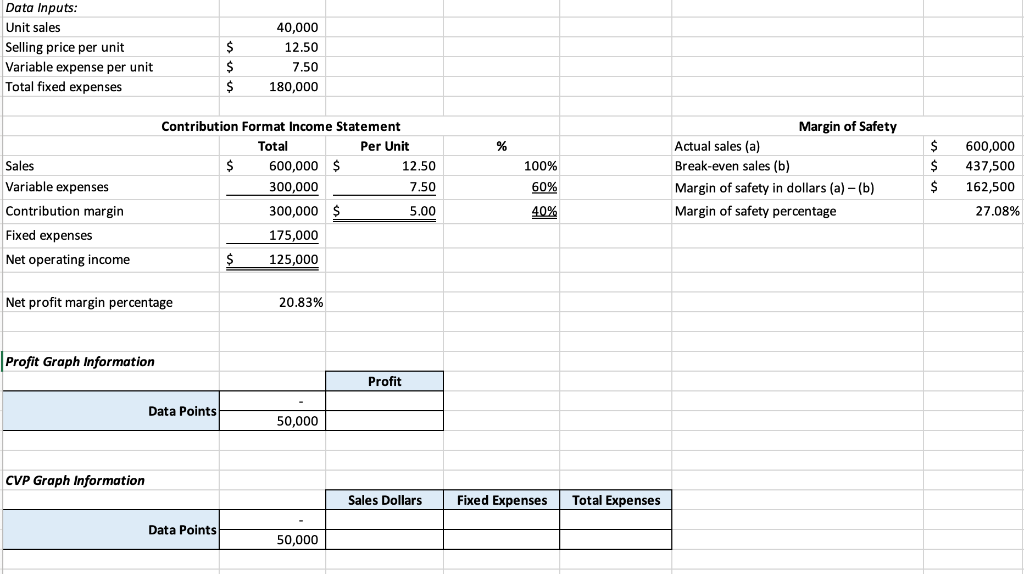
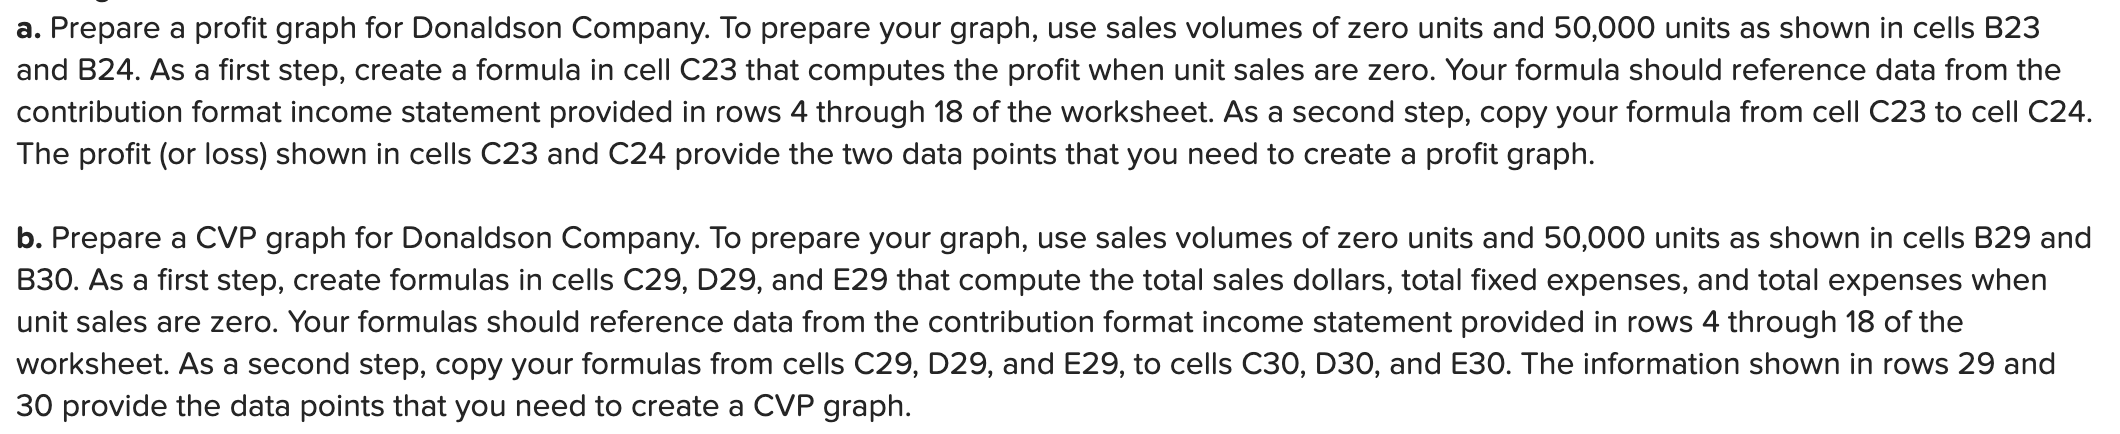
Data Inputs: Unit sales Selling price per unit Variable expense per unit Total fixed expenses $ $ $ 40,000 12.50 7.50 180,000 % Contribution Format Income Statement Total Per Unit $ 600,000 $ 12.50 300,000 7.50 300,000 $ 5.00 Sales Variable expenses Contribution margin $ $ Margin of Safety Actual sales (a) Break-even sales (b) Margin of safety in dollars (a) - (b) Margin of safety percentage 100% 60% 600,000 437,500 162,500 27.08% $ 40% Fixed expenses 175,000 Net operating income $ 125,000 Net profit margin percentage 20.83% Profit Graph Information Profit Data Points 50,000 CVP Graph Information Sales Dollars Fixed Expenses Total Expenses Data Points 50,000 a. Prepare a profit graph for Donaldson Company. To prepare your graph, use sales volumes of zero units and 50,000 units as shown in cells B23 and B24. As a first step, create a formula in cell C23 that computes the profit when unit sales are zero. Your formula should reference data from the contribution format income statement provided in rows 4 through 18 of the worksheet. As a second step, copy your formula from cell C23 to cell C24. The profit (or loss) shown in cells C23 and C24 provide the two data points that you need to create a profit graph. b. Prepare a CVP graph for Donaldson Company. To prepare your graph, use sales volumes of zero units and 50,000 units as shown in cells B29 and B30. As a first step, create formulas in cells C29, D29, and E29 that compute the total sales dollars, total fixed expenses, and total expenses when unit sales are zero. Your formulas should reference data from the contribution format income statement provided in rows 4 through 18 of the worksheet. As a second step, copy your formulas from cells C29, D29, and E29, to cells C30, D30, and E30. The information shown in rows 29 and 30 provide the data points that you need to create a CVP graph
Step by Step Solution
There are 3 Steps involved in it

Get step-by-step solutions from verified subject matter experts