

Question: data is built in r program using ToothGrowth a) Consider the R build in data ToothGrowth. Create a table for len and graph a pie
data is built in r program using ToothGrowth
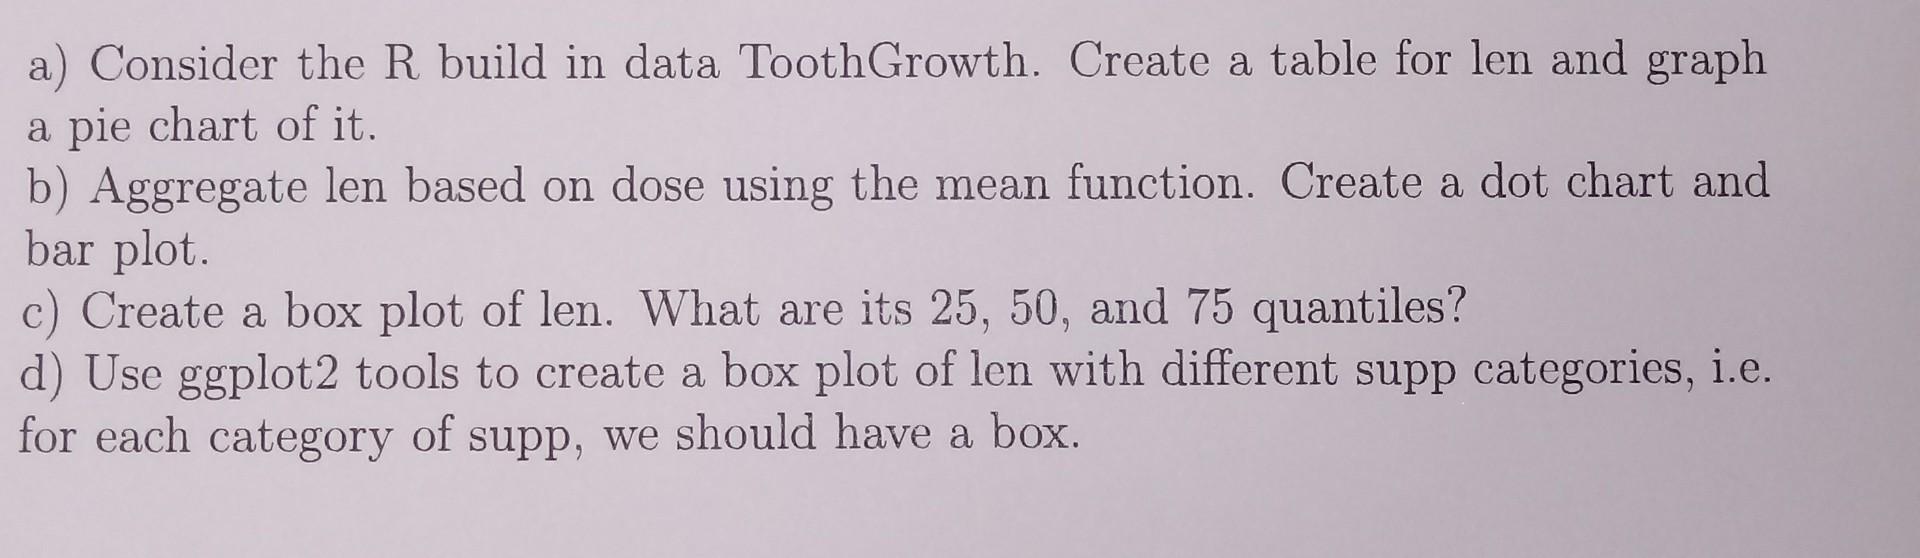
a) Consider the R build in data ToothGrowth. Create a table for len and graph a pie chart of it. b) Aggregate len based on dose using the mean function. Create a dot chart and bar plot. c) Create a box plot of len. What are its 25, 50, and 75 quantiles? d) Use ggplot2 tools to create a box plot of len with different supp categories, i.e. for each category of supp, we should have a box
Step by Step Solution
There are 3 Steps involved in it
1 Expert Approved Answer
Step: 1 Unlock

Question Has Been Solved by an Expert!
Get step-by-step solutions from verified subject matter experts
Step: 2 Unlock
Step: 3 Unlock