

Question: Procedure Part I: Circumference vs. Diameter for circular objects s = Eh b e R B. 9. Circumference Locate 3 cans, each with a different
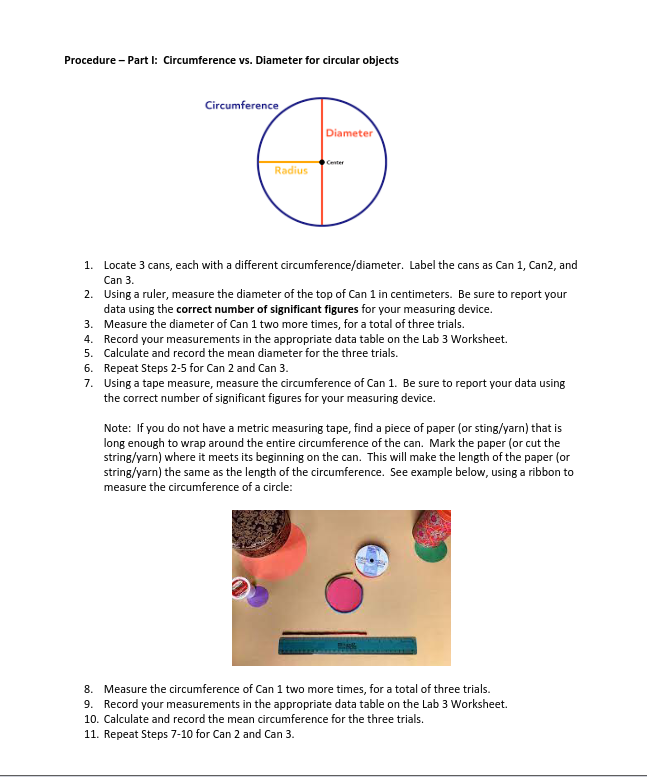
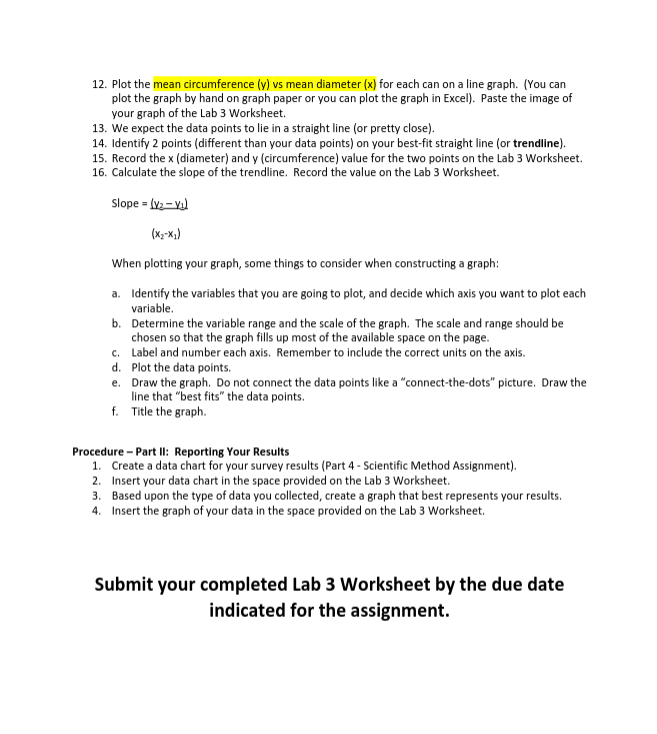
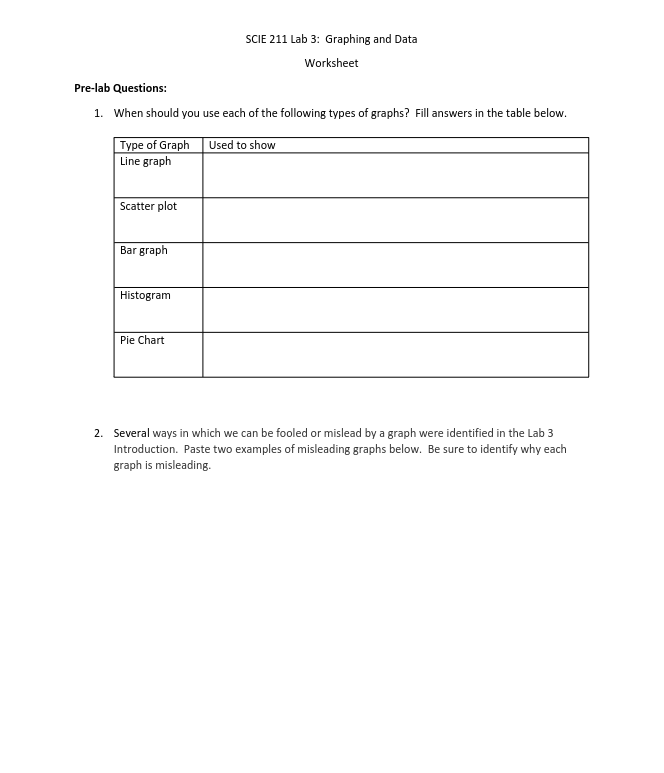
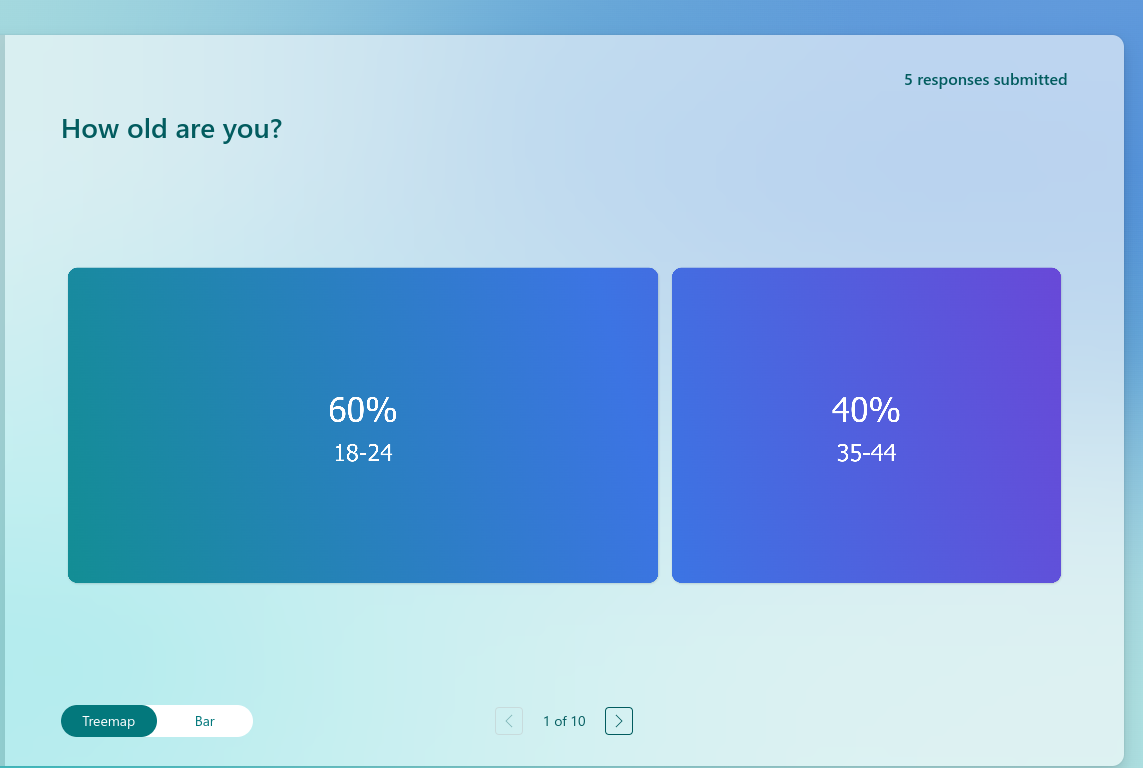
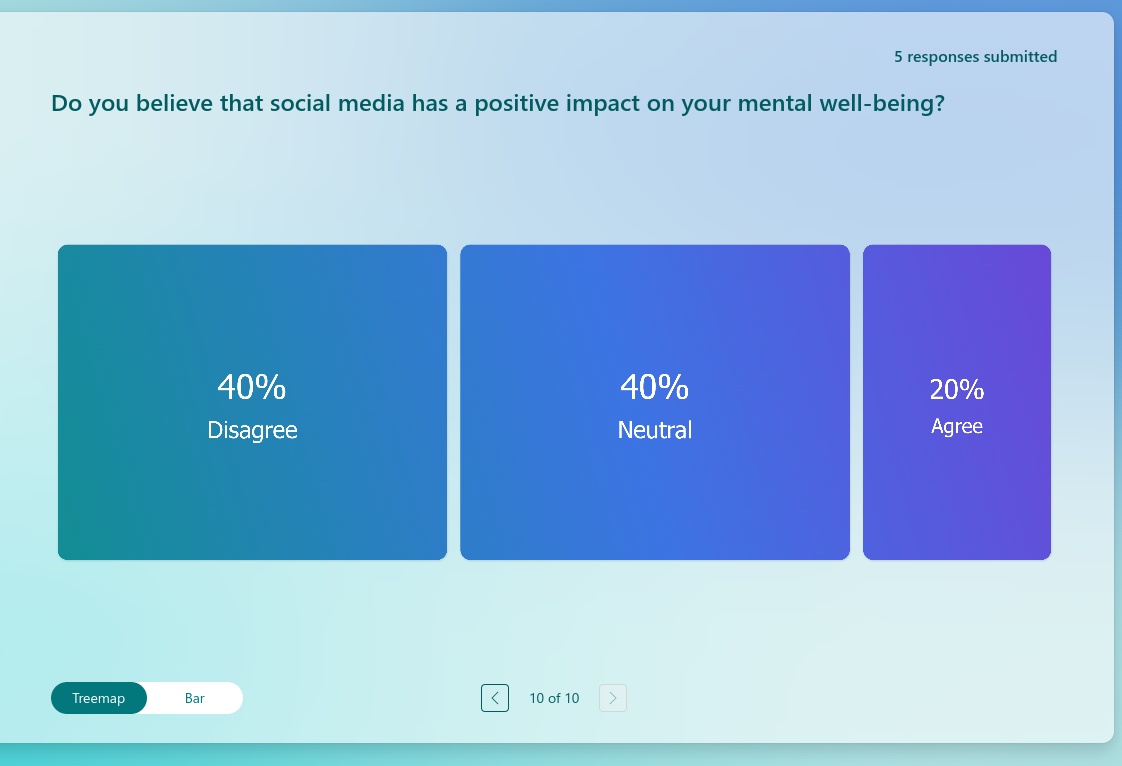
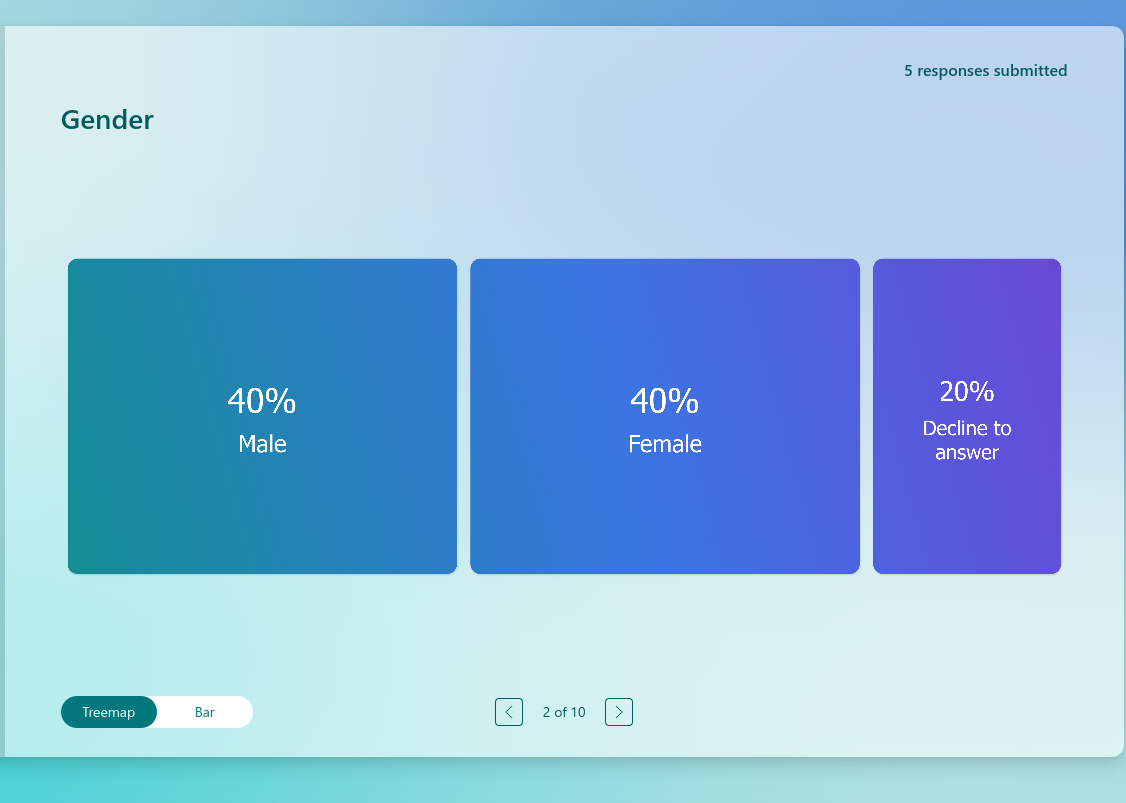

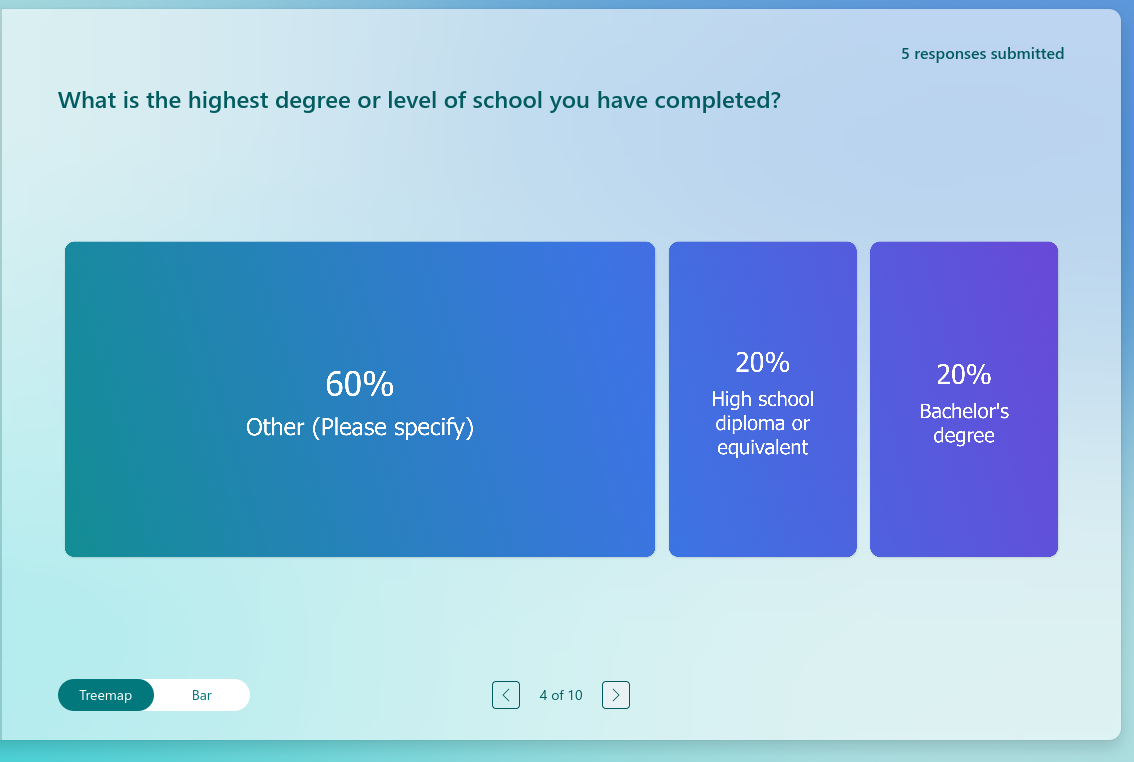
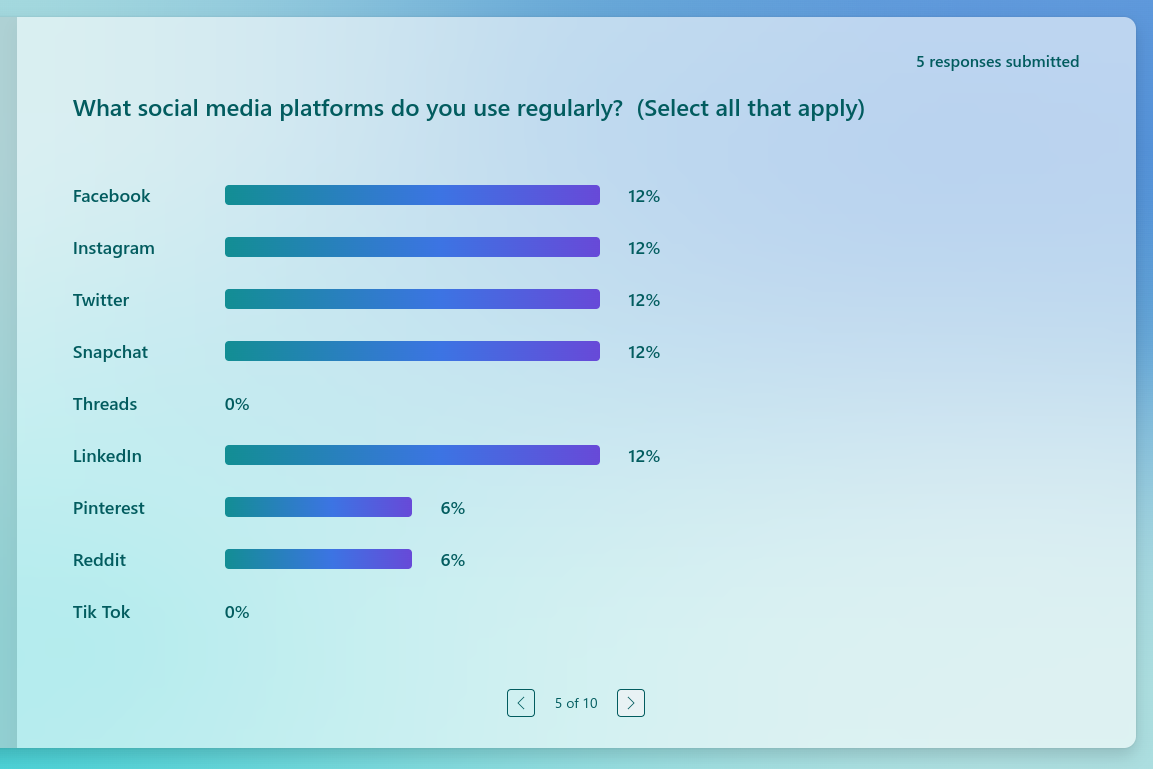
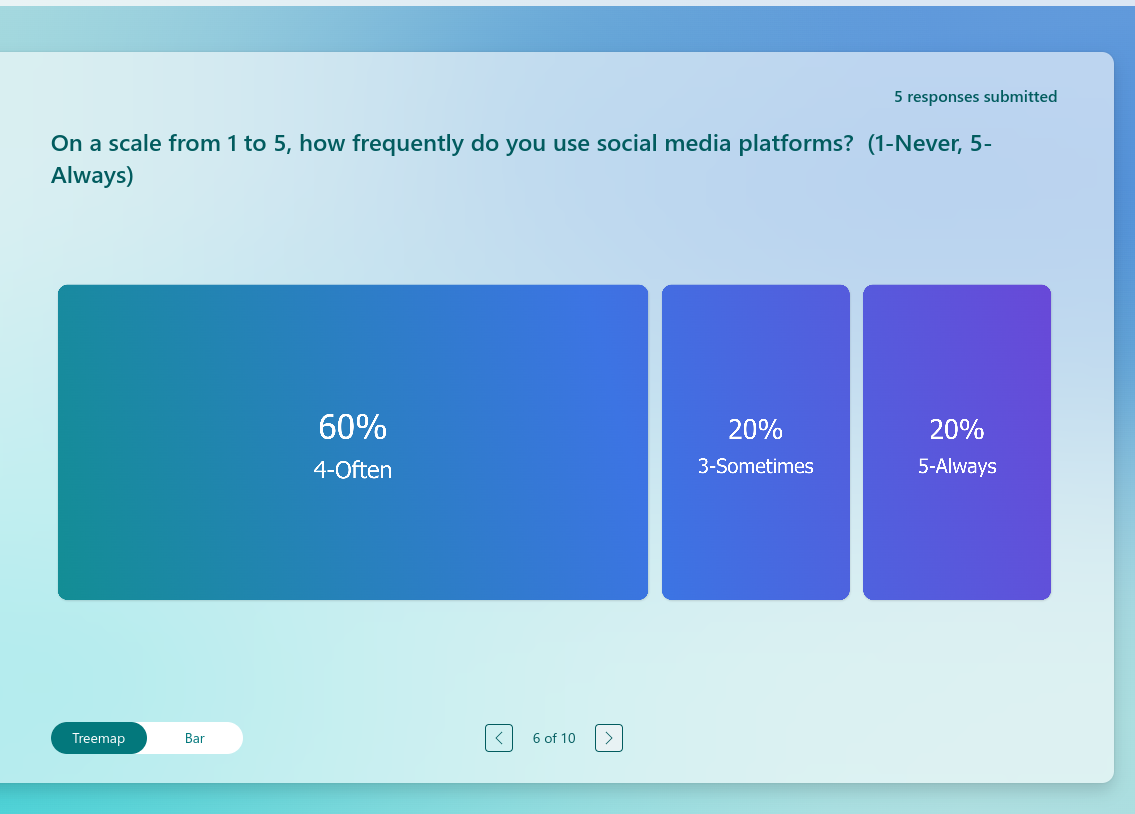
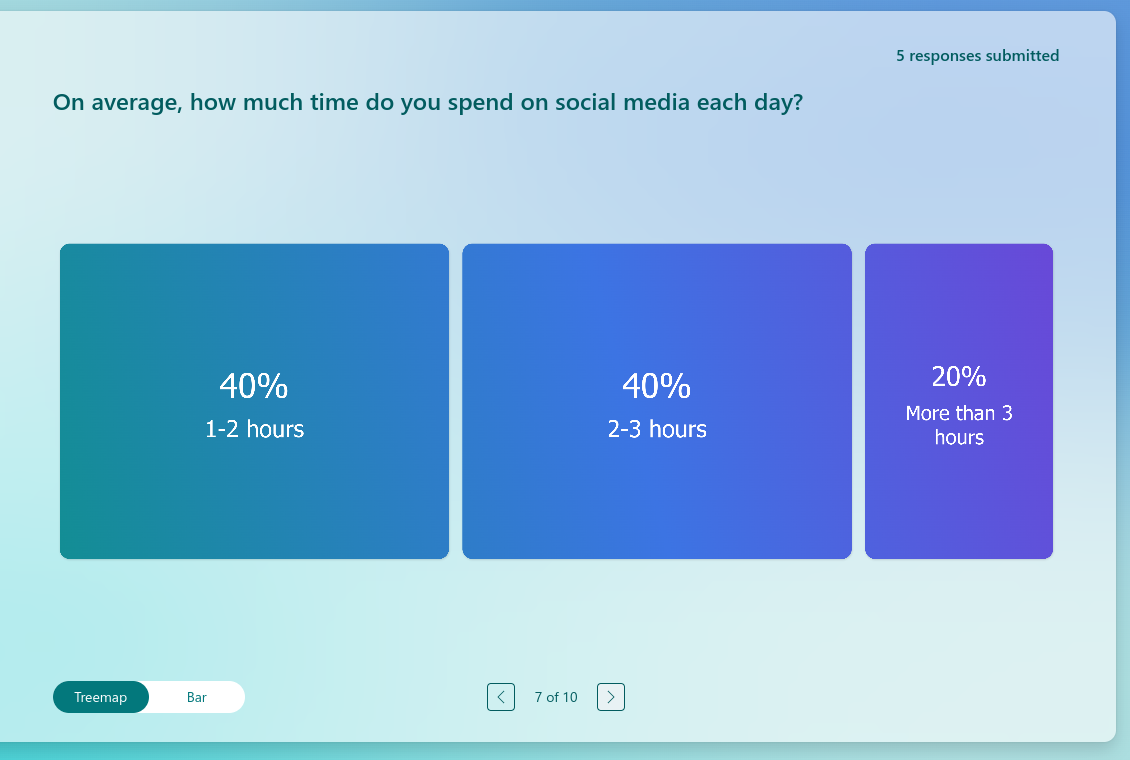
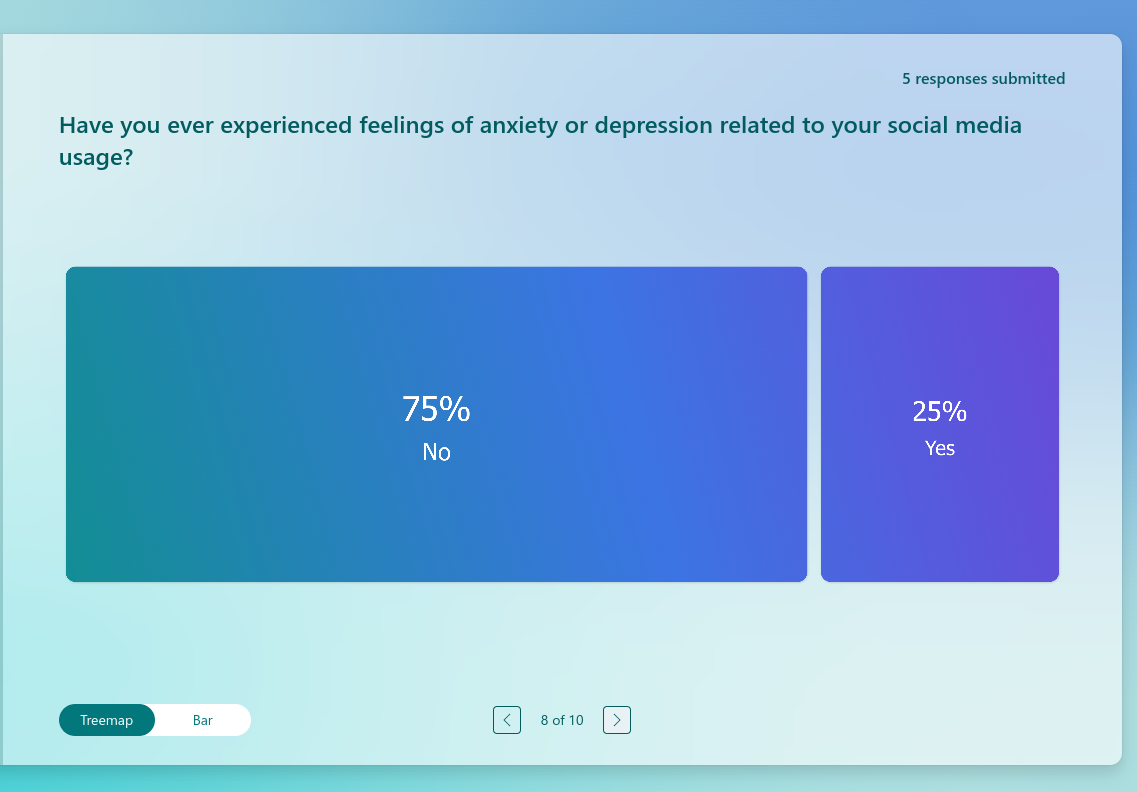
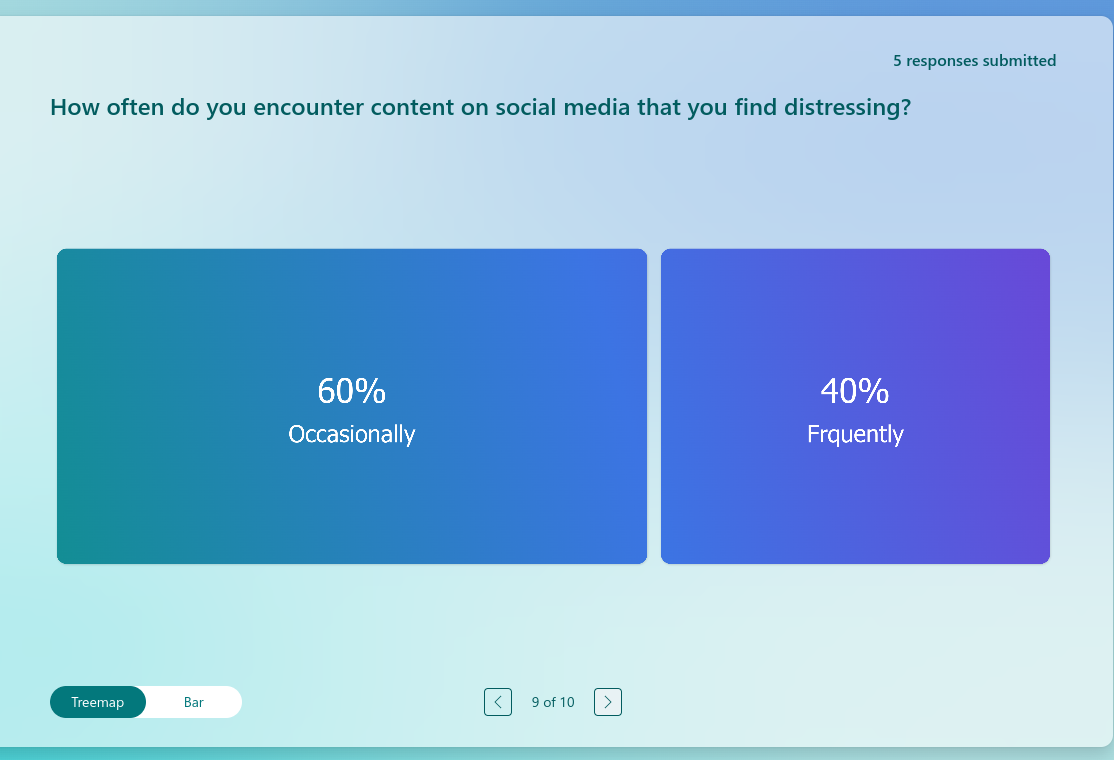
Procedure Part I: Circumference vs. Diameter for circular objects s = Eh b e R B. 9. Circumference Locate 3 cans, each with a different circumference/diameter. Label the cans as Can 1, Can2, and Can 3. Using a ruler, measure the diameter of the top of Can 1 in centimeters. Be sure to report your data using the correct number of significant figures for your measuring device. Measure the diameter of Can 1 twao mare times, for a total of three trials. Record your measurements in the appropriate data table on the Lab 3 Warksheet. Calculate and record the mean diameter for the three trials. Repeat Steps 2-5 for Can 2 and Can 3. Using a tape measure, measure the circumference of Can 1. Be sure to report your data using the correct number of significant figures for your measuring device. Mote: If you do not have a metric measuring tape, find a piece of paper (or sting/yarn) that is long enough to wrap around the entire circumference of the can. Mark the paper (or cut the stringyarn) where it meets its beginning on the can. This will make the length of the paper {or string/yarn) the same as the length of the circumference. See example below, using a ribbon to measure the circumference of a circle: WMeasure the circumference of Can 1 two more times, for a total of three trials. Record your measurements in the appropriate data table on the Lab 3 Warksheet. 10. Calculate and record the mean circumference for the three trials, 11. Repeat Steps 7-10 for Can 2 and Can 3. 12. Plot the mean circumference (y) vs mean diameter (x) for each can on a line graph. (You can plot the graph by hand on graph paper or you can plot the graph in Excel). Paste the image of your graph of the Lab 3 Worksheet, 13. We expect the data points to lie in a straight line (or pretty close). 14. Identify 2 points (different than your data points) on your best-fit straight line (or trendline). 15. Record the x (diameter) and v (circumference) value for the two points on the Lab 3 Worksheet. 16. Calculate the slope of the trendline. Record the value on the Lab 3 Worksheet. Slope = [yz vil (%37%,) When plotting your graph, some things to consider when constructing a graph: a. Identify the variables that you are going to plot, and decide which axis you want to plot each varlable, b. Determine the variable range and the scale of the graph. The scale and range should be chosen so that the graph fills up most of the avallable space on the page. c. Label and number each axis. Remember to Include the correct units on the axis. d. Plot the data points, e. Draw the graph, Do not connect the data points like a \"connect-the-dots\" picture, Draw the line that \"best fits\" the data points. f. Title the graph. Procedure = Part Il: Reporting Your Results 1. Create a data chart for your survey results (Part 4 - Sclentific Method Assignment). 2. Insert your data chart in the space provided an the Lab 3 Worksheet, 3. Based upan the type of data you collected, create a graph that best represents your results, 4, Insert the graph of your data in the space provided on the Lab 3 Worksheet, Submit your completed Lab 3 Worksheet by the due date indicated for the assignment. SCIE 211 Lab 3: Graphing Data Instructions Introduction The purpose of graphing in science is to examine the relationship between variables. A good hypothesis predicts how the two variables are related; a graph of the experimental data can help support or disprove the hypothesis. The relationship between variables can be complicated. While all graphs have numbers and labels to identify the data, there are many different kinds of graphs. The five most common types of graphs are: line graph, scatter plot, bar graph, histogram, and pie chart. Choosing the best type of graph to display your data is critical to helping you finds trends and make new discoveries. Using the wrong type of graph may hide the story your data is telling. Additionally, there are many ways we can be fooled or mislead by a graph. Some common misleading iterns we need to watch out for include: scales that do not begin at zero; scales made very small to make the graph look very big; scale values or labels missing from the graph; incorrect scales placed on the graph; pieces of a Pie Chart that are not the correct size; oversized volumes of objects that are too big for the vertical scale differences they represent; size of images used in Pictographs being different for the different categories being graphed; and, graphs being a non-standard size or shape In this lab, you will practice graphing and analyzing data by considering the simple case of a linear relationship between variables. ou will also graph the data you collected for Part 4 of the Scientific Method assignment. Objectives: After completing this laboratory, you should be able to: |dentify the basic types of graphs Analyze and evaluate graphs e Create agraph Materials: 3 cans (different sizes) Ruler Tape measure (or piece of paper or piece of string/yamn) Labworksheet Calculator SCIE 211 Lab 3: Graphing and Data Worksheet Pre-lab Questions: 1. When should you use each of the following types of graphs? Fill answers in the table below. Type of Graph Line graph Scatter plot Histogram Pie Chart o _ 2. Several ways in which we can be fooled or mislead by a graph were identified in the Lab 3 Introduction. Paste two examples of misleading graphs below. Be sure to identify why each graph is misleading. Part I - Data Charts: Circumference (y) vs. Diameter (x) for circular objects Diameter (x) Can 1 (cm) Can 2 (cm) Can 3 (cm) Trial 1 Trial 2 Trial 3 Mean Circumference (y) Can 1 (cm) Can 2 (cm) Can 3 (cm) Trial 1 Trial 2 Trial 3 Mean Insert your graph of the can data with a trend line - Mean Circumference (y) Vs. Mean Diameter (x) Identify 2 points of the trendline. YI= Y2= X1 =. X2 = Calculate Slope of the Trendline (as in the instructions) =Part Il Reporting Your Survey Data for the Scientific Method Project Your Hypothesis: Data table of the results of your survey: Graph of your survey results: Post-lab Questions: 1. Answer the questions below about the can data. You will need to following equation to answer part b. Circumference ={m )(Diameter) a. What was the calculated value for the slope of your trendline? b. What is the expected or true value for the slope of your trendline? [Hint: What is the relationship between the circumference and the diameter of a circle?) c. Calculate the % error. % error = (calculated value expected value] x 100% expected value d. Based upon your % error, how good were your measurements? What are other sources of error? 2. Explain your rationale for the type of graph you chose to display the data you collected from YOUT survey., 3. Mow that you have graphed your survey data, did you choose correctly? Why or why not? \f5 responses submitted Do you believe that social media has a positive impact on your mental well-being? 40% 40% Disagree Neutral Bar 10 of 10 1 \f5 responses submitted What is your employment status? 40% 40% 20% Full-time Other (Please Specify) Part-time Treemap Bar 5 responses submitted What is the highest degree or level of school you have completed? 20% 60% 20% High school Other (Please specify) diploma or Bachelor's equivalent degree Treemap Bar 5 responses submitted What social media platforms do you use regularly? (Select all that apply) Facebook 12% Instagram 12% Twitter 12% Snapchat 12% Threads 0% LinkedIn 12% Pinterest 6% Reddit 6% Tik Tok 0% 5 responses submitted On a scale from 1 to 5, how frequently do you use social media platforms? (1-Never, 5- Always) 20% 20% 3-Sometimes R\\ I IN Bar 6 of 10 5 responses submitted On average, how much time do you spend on social media each day? 40% AN More than 3 S hOUfS o 5 responses submitted Have you ever experienced feelings of anxiety or depression related to your social media usage? 5 responses submitted How often do you encounter content on social media that you find distressing? 60% 40% Occasionally Frquently Bar 9of 10
Step by Step Solution
There are 3 Steps involved in it

Get step-by-step solutions from verified subject matter experts