

Question: Data is complete. Please check all 3 pictures since its the same problem. 3. The UNCW store manager requested all employees to report the average
Data is complete. Please check all 3 pictures since its the same problem.
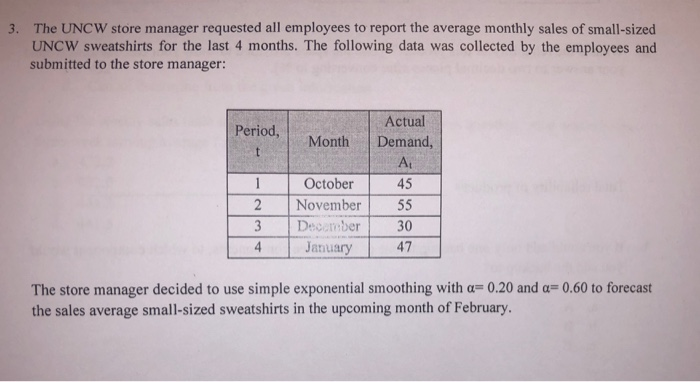
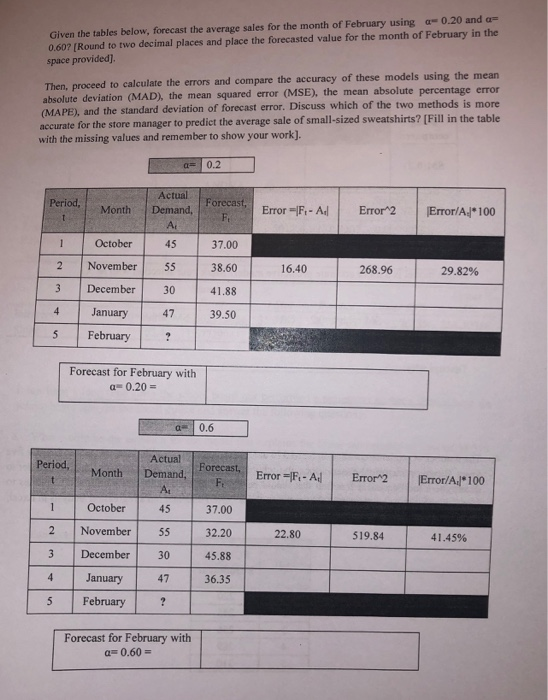
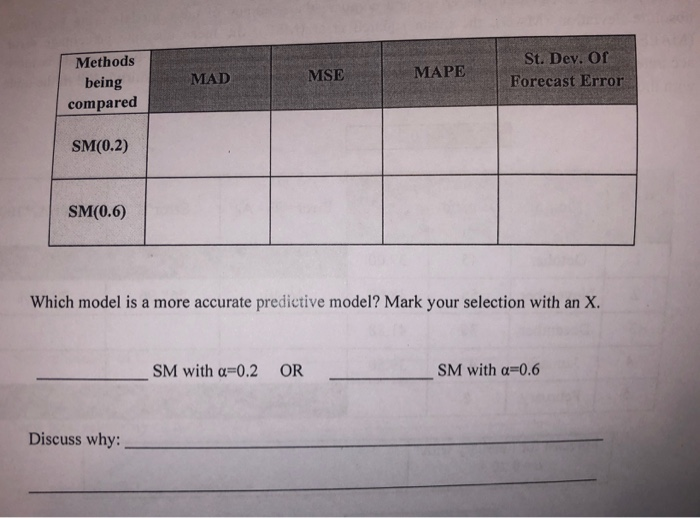
3. The UNCW store manager requested all employees to report the average monthly sales of small-sized UNCW sweatshirts for the last 4 months. The following data was collected by the employees and submitted to the store manager: Period, Month Actual Demand, AL 45 55 2 October November December January 30 3 4 47 The store manager decided to use simple exponential smoothing with a=0.20 and a=0.60 to forecast the sales average small-sized sweatshirts in the upcoming month of February. Given the tables below. forecast the average sales for the month of February using 0.20 and a 0.607 (Round to two decimal places and place the forecasted value for the month of February in the space provided) Then, proceed to calculate the errors and compare the accuracy of these models using the mean absolute deviation (MAD), the mean squared error (MSE), the mean absolute percentage error (MAPE), and the standard deviation of forecast error. Discuss which of the two methods is more accurate for the store manager to predict the average sale of small-sized sweatshirts? [Fill in the table with the missing values and remember to show your work). q- 0.2 Period Month Forecast. F, Error-F,- Ad Error2 Error/A./*100 Actual Demand, 45 October 37.00 16.40 268.96 29.82% November December 55 30 38.60 41.88 47 39.50 January February 5 Forecast for February with Q=0.20 = Q= 0.6 Period, Actual Demand, Forecast, Month Error =1F - AJ F. Error 2 Error/A./ 100 45 37.00 55 22.80 519.84 41.45% 2 3 October November December January February 32.20 45.88 30 47 36.35 5 Forecast for February with a=0.60 = MSE Methods being compared MAD MAPE St. Dev. Of Forecast Error SM(0.2) SM(0.6) Which model is a more accurate predictive model? Mark your selection with an X. SM with a=0.2 OR SM with a=0.6 Discuss why Step by Step Solution
There are 3 Steps involved in it
1 Expert Approved Answer
Step: 1 Unlock

Question Has Been Solved by an Expert!
Get step-by-step solutions from verified subject matter experts
Step: 2 Unlock
Step: 3 Unlock