

Question: Data is just a sample - please provide step by step instruction Scenario: A city's administration isn't driven by the goal of maximizing revenues or
Data is just a sample - please provide step by step instruction
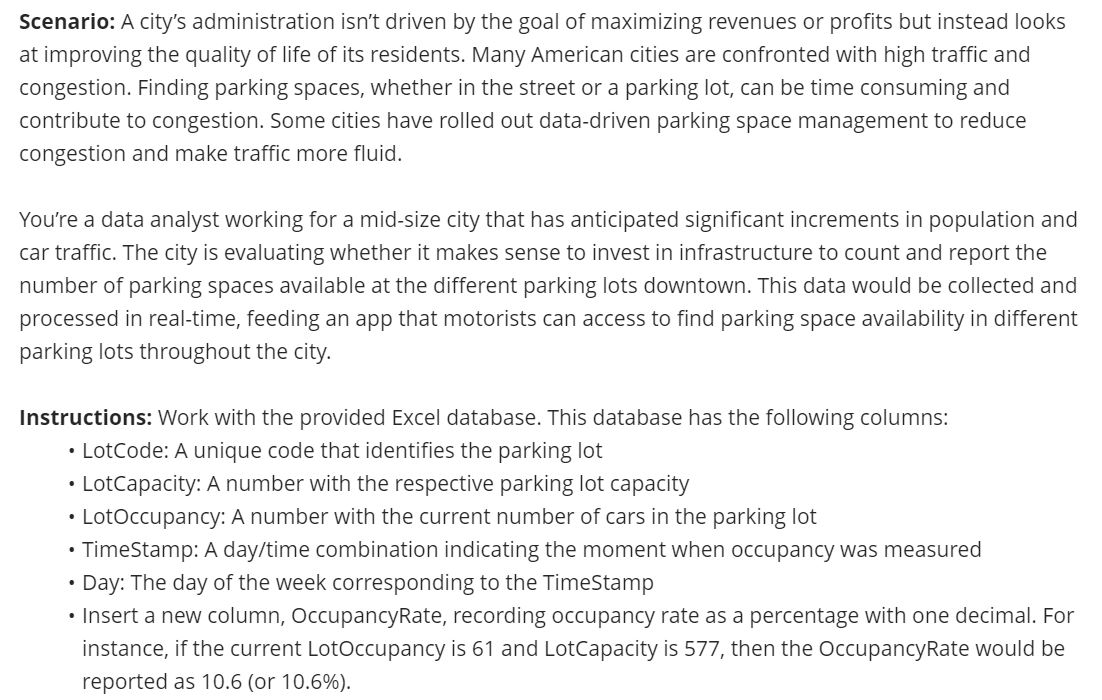
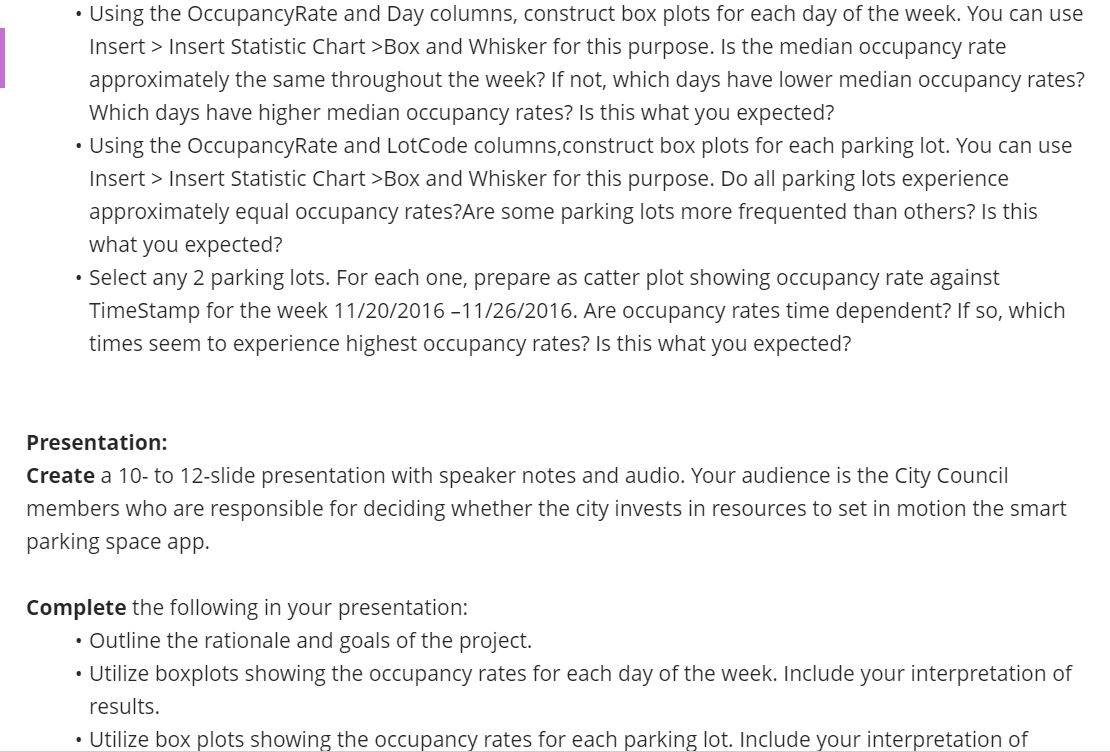
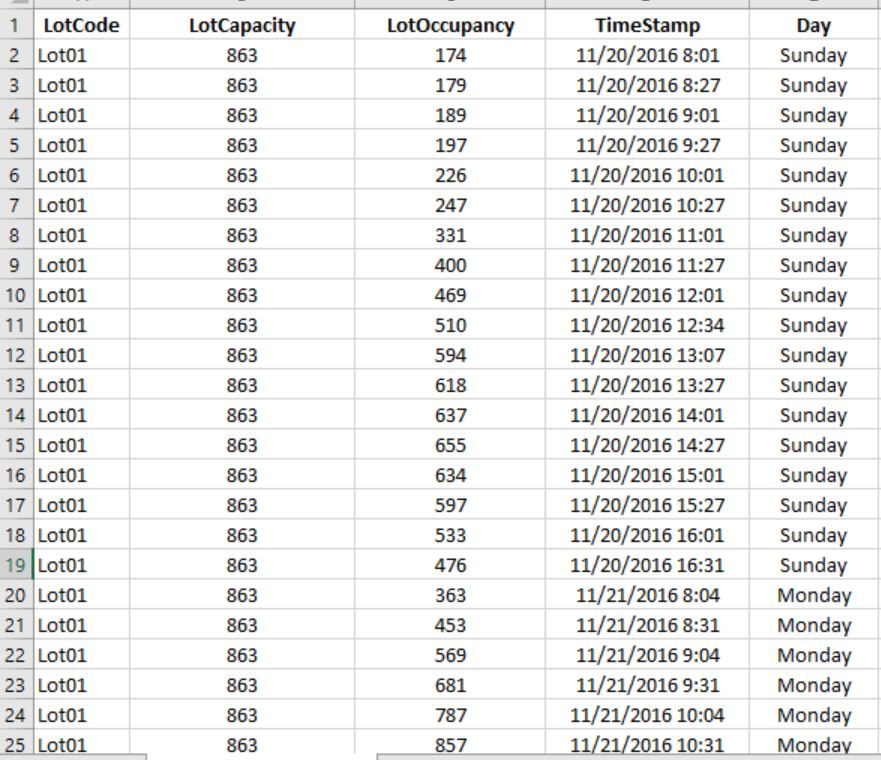
Scenario: A city's administration isn't driven by the goal of maximizing revenues or profits but instead looks at improving the quality of life of its residents. Many American cities are confronted with high traffic and congestion. Finding parking spaces, whether in the street or a parking lot, can be time consuming and contribute to congestion. Some cities have rolled out data-driven parking space management to reduce congestion and make traffic more fluid. You're a data analyst working for a mid-size city that has anticipated significant increments in population and car traffic. The city is evaluating whether it makes sense to invest in infrastructure to count and report the number of parking spaces available at the different parking lots downtown. This data would be collected and processed in real-time, feeding an app that motorists can access to find parking space availability in different parking lots throughout the city. Instructions: Work with the provided Excel database. This database has the following columns: LotCode: A unique code that identifies the parking lot LotCapacity: A number with the respective parking lot capacity LotOccupancy: A number with the current number of cars in the parking lot TimeStamp: A day/time combination indicating the moment when occupancy was measured Day: The day of the week corresponding to the TimeStamp Insert a new column, OccupancyRate, recording occupancy rate as a percentage with one decimal. For instance, if the current LotOccupancy is 61 and LotCapacity is 577, then the OccupancyRate would be reported as 10.6 (or 10.6%). . Using the OccupancyRate and Day columns, construct box plots for each day of the week. You can use Insert > Insert Statistic Chart >Box and Whisker for this purpose. Is the median occupancy rate approximately the same throughout the week? If not, which days have lower median occupancy rates? Which days have higher median occupancy rates? Is this what you expected? Using the OccupancyRate and LotCode columns, construct box plots for each parking lot. You can use Insert > Insert Statistic Chart >Box and Whisker for this purpose. Do all parking lots experience approximately equal occupancy rates?Are some parking lots more frequented than others? Is this what you expected? Select any 2 parking lots. For each one, prepare as catter plot showing occupancy rate against Timestamp for the week 11/20/2016-11/26/2016. Are occupancy rates time dependent? If so, which times seem to experience highest occupancy rates? Is this what you expected? Presentation: Create a 10-to 12-slide presentation with speaker notes and audio. Your audience is the City Council members who are responsible for deciding whether the city invests in resources to set in motion the smart parking space app. Complete the following in your presentation: Outline the rationale and goals of the project. Utilize boxplots showing the occupancy rates for each day of the week. Include your interpretation of results. Utilize box plots showing the occupancy rates for each parking lot. Include your interpretation of Complete the following in your presentation: Outline the rationale and goals of the project. Utilize boxplots showing the occupancy rates for each day of the week. Include your interpretation of results. Utilize box plots showing the occupancy rates for each parking lot. Include your interpretation of results. Provide scatter plots showing occupancy rate against time of day of your selected four parking lots. Include your interpretation of results. Make a recommendation about continuing with the implementation of this project. LotOccupancy 174 179 189 197 226 247 331 400 1 LotCode 2 Loto1 3 Lot01 4 Lot01 5 Lot01 6 Lot01 7 Lot01 8 Loto1 9 Lot01 10 Lot01 11 Lot01 12 Lot01 13 Loto1 14 Loto1 15 Lot01 16 Lot01 17 Lot01 18 Lot01 19 Lot01 20 Lot01 21 Loto1 22 Lot01 23 Lot01 24 Lot01 25 Loto1 LotCapacity 863 863 863 863 863 863 863 863 863 863 863 863 863 863 863 863 863 863 863 863 863 863 863 863 469 510 594 618 637 655 634 TimeStamp 11/20/2016 8:01 11/20/2016 8:27 11/20/2016 9:01 11/20/2016 9:27 11/20/2016 10:01 11/20/2016 10:27 11/20/2016 11:01 11/20/2016 11:27 11/20/2016 12:01 11/20/2016 12:34 11/20/2016 13:07 11/20/2016 13:27 11/20/2016 14:01 11/20/2016 14:27 11/20/2016 15:01 11/20/2016 15:27 11/20/2016 16:01 11/20/2016 16:31 11/21/2016 8:04 11/21/2016 8:31 11/21/2016 9:04 11/21/2016 9:31 11/21/2016 10:04 11/21/2016 10:31 Day Sunday Sunday Sunday Sunday Sunday Sunday Sunday Sunday Sunday Sunday Sunday Sunday Sunday Sunday Sunday Sunday Sunday Sunday Monday Monday Monday Monday Monday Monday 597 533 476 363 453 569 681 787 857 Scenario: A city's administration isn't driven by the goal of maximizing revenues or profits but instead looks at improving the quality of life of its residents. Many American cities are confronted with high traffic and congestion. Finding parking spaces, whether in the street or a parking lot, can be time consuming and contribute to congestion. Some cities have rolled out data-driven parking space management to reduce congestion and make traffic more fluid. You're a data analyst working for a mid-size city that has anticipated significant increments in population and car traffic. The city is evaluating whether it makes sense to invest in infrastructure to count and report the number of parking spaces available at the different parking lots downtown. This data would be collected and processed in real-time, feeding an app that motorists can access to find parking space availability in different parking lots throughout the city. Instructions: Work with the provided Excel database. This database has the following columns: LotCode: A unique code that identifies the parking lot LotCapacity: A number with the respective parking lot capacity LotOccupancy: A number with the current number of cars in the parking lot TimeStamp: A day/time combination indicating the moment when occupancy was measured Day: The day of the week corresponding to the TimeStamp Insert a new column, OccupancyRate, recording occupancy rate as a percentage with one decimal. For instance, if the current LotOccupancy is 61 and LotCapacity is 577, then the OccupancyRate would be reported as 10.6 (or 10.6%). . Using the OccupancyRate and Day columns, construct box plots for each day of the week. You can use Insert > Insert Statistic Chart >Box and Whisker for this purpose. Is the median occupancy rate approximately the same throughout the week? If not, which days have lower median occupancy rates? Which days have higher median occupancy rates? Is this what you expected? Using the OccupancyRate and LotCode columns, construct box plots for each parking lot. You can use Insert > Insert Statistic Chart >Box and Whisker for this purpose. Do all parking lots experience approximately equal occupancy rates?Are some parking lots more frequented than others? Is this what you expected? Select any 2 parking lots. For each one, prepare as catter plot showing occupancy rate against Timestamp for the week 11/20/2016-11/26/2016. Are occupancy rates time dependent? If so, which times seem to experience highest occupancy rates? Is this what you expected? Presentation: Create a 10-to 12-slide presentation with speaker notes and audio. Your audience is the City Council members who are responsible for deciding whether the city invests in resources to set in motion the smart parking space app. Complete the following in your presentation: Outline the rationale and goals of the project. Utilize boxplots showing the occupancy rates for each day of the week. Include your interpretation of results. Utilize box plots showing the occupancy rates for each parking lot. Include your interpretation of Complete the following in your presentation: Outline the rationale and goals of the project. Utilize boxplots showing the occupancy rates for each day of the week. Include your interpretation of results. Utilize box plots showing the occupancy rates for each parking lot. Include your interpretation of results. Provide scatter plots showing occupancy rate against time of day of your selected four parking lots. Include your interpretation of results. Make a recommendation about continuing with the implementation of this project. LotOccupancy 174 179 189 197 226 247 331 400 1 LotCode 2 Loto1 3 Lot01 4 Lot01 5 Lot01 6 Lot01 7 Lot01 8 Loto1 9 Lot01 10 Lot01 11 Lot01 12 Lot01 13 Loto1 14 Loto1 15 Lot01 16 Lot01 17 Lot01 18 Lot01 19 Lot01 20 Lot01 21 Loto1 22 Lot01 23 Lot01 24 Lot01 25 Loto1 LotCapacity 863 863 863 863 863 863 863 863 863 863 863 863 863 863 863 863 863 863 863 863 863 863 863 863 469 510 594 618 637 655 634 TimeStamp 11/20/2016 8:01 11/20/2016 8:27 11/20/2016 9:01 11/20/2016 9:27 11/20/2016 10:01 11/20/2016 10:27 11/20/2016 11:01 11/20/2016 11:27 11/20/2016 12:01 11/20/2016 12:34 11/20/2016 13:07 11/20/2016 13:27 11/20/2016 14:01 11/20/2016 14:27 11/20/2016 15:01 11/20/2016 15:27 11/20/2016 16:01 11/20/2016 16:31 11/21/2016 8:04 11/21/2016 8:31 11/21/2016 9:04 11/21/2016 9:31 11/21/2016 10:04 11/21/2016 10:31 Day Sunday Sunday Sunday Sunday Sunday Sunday Sunday Sunday Sunday Sunday Sunday Sunday Sunday Sunday Sunday Sunday Sunday Sunday Monday Monday Monday Monday Monday Monday 597 533 476 363 453 569 681 787 857Step by Step Solution
There are 3 Steps involved in it
1 Expert Approved Answer
Step: 1 Unlock

Question Has Been Solved by an Expert!
Get step-by-step solutions from verified subject matter experts
Step: 2 Unlock
Step: 3 Unlock