

Question: Data on benchmark US T-bonds are provided below. Three proposed US T-bond portfolios I, II, III are also shown. Each has the same market value
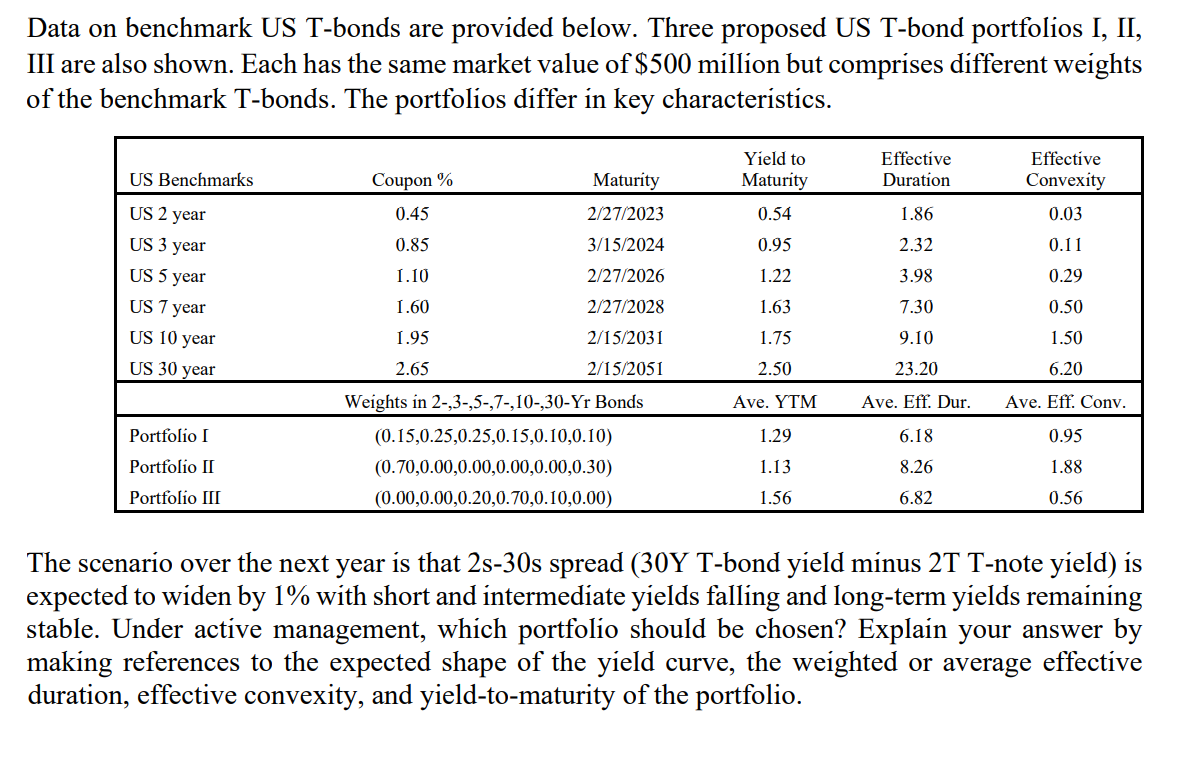
Data on benchmark US T-bonds are provided below. Three proposed US T-bond portfolios I, II, III are also shown. Each has the same market value of $500 million but comprises different weights of the benchmark T-bonds. The portfolios differ in key characteristics. US Benchmarks Coupon % Maturity Yield to Maturity Effective Duration Effective Convexity US 2 year 0.45 2/27/2023 0.54 1.86 0.03 US 3 year 0.85 3/15/2024 0.95 2.32 0.11 US 5 year 1.10 2/27/2026 1.22 3.98 0.29 US 7 year 1.60 2/27/2028 1.63 7.30 0.50 US 10 year 1.95 2/15/2031 1.75 9.10 1.50 US 30 year 2.65 2/15/2051 2.50 23.20 6.20 Weights in 2-,3-,5-,7-,10-,30-Yr Bonds Ave. YTM Ave. Eff. Dur. Ave. Eff. Conv. Portfolio I (0.15,0.25,0.25,0.15,0.10,0.10) 1.29 6.18 0.95 Portfolio II (0.70,0.00,0.00,0.00,0.00,0.30) 1.13 8.26 1.88 Portfolio III (0.00,0.00,0.20,0.70,0.10,0.00) 1.56 6.82 0.56 The scenario over the next year is that 2s-30s spread (30Y T-bond yield minus 2T T-note yield) is expected to widen by 1% with short and intermediate yields falling and long-term yields remaining stable. Under active management, which portfolio should be chosen? Explain your answer by making references to the expected shape of the yield curve, the weighted or average effective duration, effective convexity, and yield-to-maturity of the portfolio.
Step by Step Solution
There are 3 Steps involved in it

Get step-by-step solutions from verified subject matter experts