

Question: Data Reduction and Error Analysis for physical sciences. * Exercise: 1.8 Justify the a-nd equality in Equations (1.8) and (1.14) Rection and Eur Antly Uncertainties
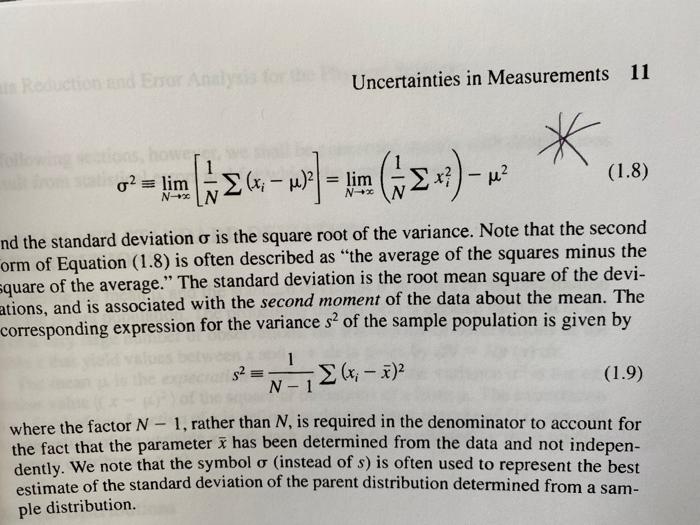
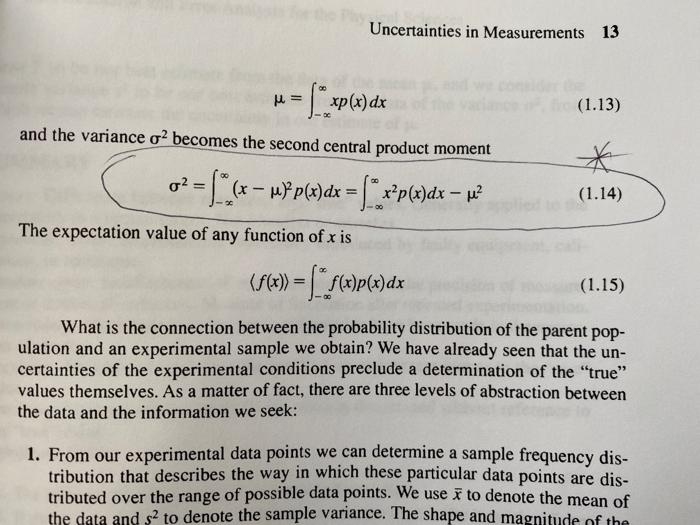
Data Reduction and Error Analysis for physical sciences. * Exercise: 1.8 Justify the a-nd equality in Equations (1.8) and (1.14) Rection and Eur Antly Uncertainties in Measurements 11 * o2 = lim bin - w) _m (424) -- M2 (1.8) nd the standard deviation o is the square root of the variance. Note that the second orm of Equation (1.8) is often described as "the average of the squares minus the square of the average. The standard deviation is the root mean square of the devi- ations, and is associated with the second moment of the data about the mean. The corresponding expression for the variance s? of the sample population is given by S2 = (x; - x)2 (1.9) where the factor N - 1, rather than N, is required in the denominator to account for the fact that the parameter x has been determined from the data and not indepen- dently. We note that the symbol o (instead of s) is often used to represent the best estimate of the standard deviation of the parent distribution determined from a sam- ple distribution. Uncertainties in Measurements 13 = L* xp(x) dx (1.13) and the variance o2 becomes the second central product moment * 02= [ (v - upp()dx = xp(a)dx u? (1.14) The expectation value of any function of x is (F(x) = L* $*]()dx (1.15) What is the connection between the probability distribution of the parent pop- ulation and an experimental sample we obtain? We have already seen that the un- certainties of the experimental conditions preclude a determination of the "true" values themselves. As a matter of fact, there are three levels of abstraction between the data and the information we seek: 1. From our experimental data points we can determine a sample frequency dis- tribution that describes the way in which these particular data points are dis- tributed over the range of possible data points. We use i to denote the mean of the data and 52 to denote the sample variance. The shape and magnitude of the and (1.14) We have to use numpy in python to solve the
Step by Step Solution
There are 3 Steps involved in it

Get step-by-step solutions from verified subject matter experts