

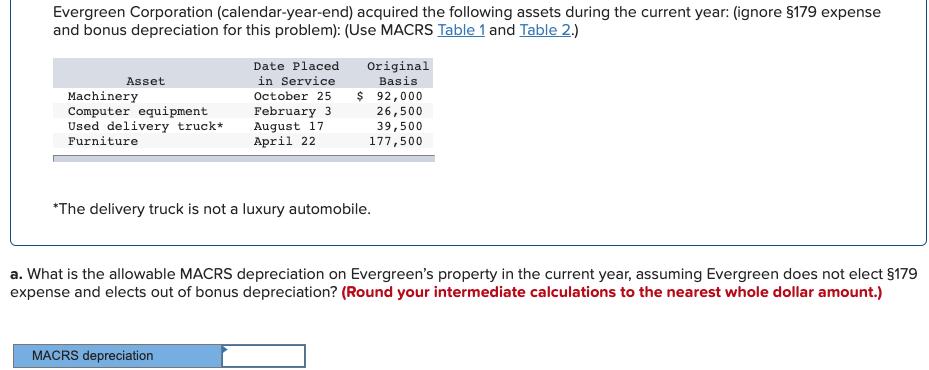
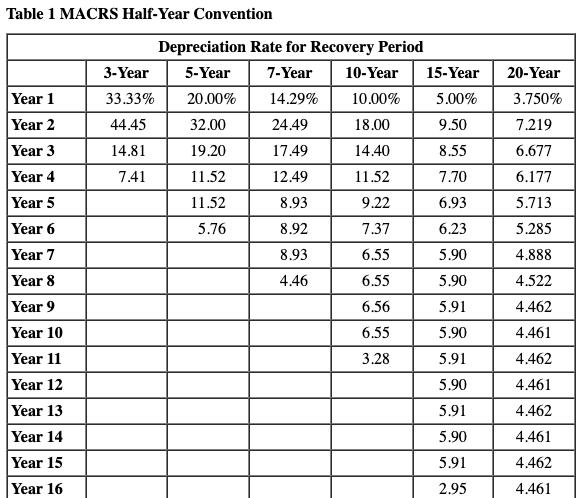
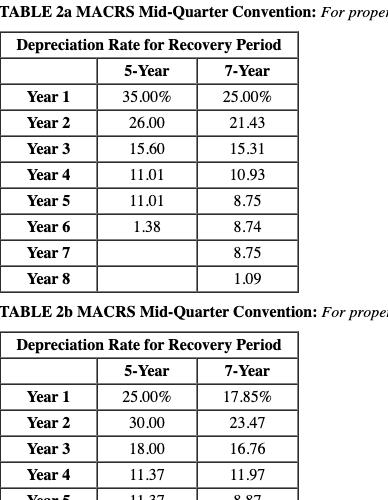
Table 1 MACRS Half-Year Convention Depreciation Rate for Recovery Period 3-Year 5-Year 7-Year 10-Year 15-Year 20-Year...
Fantastic news! We've Found the answer you've been seeking!
Question:
Transcribed Image Text:
Table 1 MACRS Half-Year Convention Depreciation Rate for Recovery Period 3-Year 5-Year 7-Year 10-Year 15-Year 20-Year Year 1 Year 2 33.33% 20.00% 14.29% 10.00% 5.00% 3.750% 44.45 32.00 24.49 18.00 9.50 7.219 Year 3 14.81 19.20 17.49 14.40 8.55 6.677 Year 4 7.41 11.52 12.49 11.52 7.70 6.177 Year 5 11.52 8.93 9.22 6.93 5.713 Year 6 Year 7 Year 8 5.76 8.92 7.37 6.23 5.285 8.93 6.55 5.90 4.888 4.46 6.55 5.90 4.522 Year 9 6.56 5.91 4.462 Year 10 Year 11 Year 12 6.55 5.90 4.461 3.28 5.91 4.462 5.90 4.461 Year 13 5.91 4.462 Year 14 5.90 4.461 Year 15 5.91 4.462 Year 16 2.95 4.461 TABLE 2a MACRS Mid-Quarter Convention: For proper Depreciation Rate for Recovery Period 5-Year 7-Year Year 1 35.00% 25.00% Year 2 26.00 21.43 Year 3 15.60 15.31 Year 4 11.01 10.93 Year 5 11.01 8.75 Year 6 1.38 8.74 Year 7 8.75 Year 8 1.09 TABLE 2b MACRS Mid-Quarter Convention: For prope Depreciation Rate for Recovery Period 5-Year 7-Year Year 1 25.00% 17.85% Year 2 30.00 23.47 Year 3 18.00 16.76 Year 4 11.37 11.97 Voom 11. 27 O 07 TABLE 2a MACRS Mid-Quarter Convention: For proper Depreciation Rate for Recovery Period 5-Year 7-Year Year 1 35.00% 25.00% Year 2 26.00 21.43 Year 3 15.60 15.31 Year 4 11.01 10.93 Year 5 11.01 8.75 Year 6 1.38 8.74 Year 7 8.75 Year 8 1.09 TABLE 2b MACRS Mid-Quarter Convention: For prope Depreciation Rate for Recovery Period 5-Year 7-Year Year 1 25.00% 17.85% Year 2 30.00 23.47 Year 3 18.00 16.76 Year 4 11.37 11.97 Voom 11. 27 O 07 Table 1 MACRS Half-Year Convention Depreciation Rate for Recovery Period 3-Year 5-Year 7-Year 10-Year 15-Year 20-Year Year 1 Year 2 33.33% 20.00% 14.29% 10.00% 5.00% 3.750% 44.45 32.00 24.49 18.00 9.50 7.219 Year 3 14.81 19.20 17.49 14.40 8.55 6.677 Year 4 7.41 11.52 12.49 11.52 7.70 6.177 Year 5 11.52 8.93 9.22 6.93 5.713 Year 6 Year 7 Year 8 5.76 8.92 7.37 6.23 5.285 8.93 6.55 5.90 4.888 4.46 6.55 5.90 4.522 Year 9 6.56 5.91 4.462 Year 10 Year 11 Year 12 6.55 5.90 4.461 3.28 5.91 4.462 5.90 4.461 Year 13 5.91 4.462 Year 14 5.90 4.461 Year 15 5.91 4.462 Year 16 2.95 4.461 TABLE 2a MACRS Mid-Quarter Convention: For proper Depreciation Rate for Recovery Period 5-Year 7-Year Year 1 35.00% 25.00% Year 2 26.00 21.43 Year 3 15.60 15.31 Year 4 11.01 10.93 Year 5 11.01 8.75 Year 6 1.38 8.74 Year 7 8.75 Year 8 1.09 TABLE 2b MACRS Mid-Quarter Convention: For prope Depreciation Rate for Recovery Period 5-Year 7-Year Year 1 25.00% 17.85% Year 2 30.00 23.47 Year 3 18.00 16.76 Year 4 11.37 11.97 Voom 11. 27 O 07 Table 1 MACRS Half-Year Convention Depreciation Rate for Recovery Period 3-Year 5-Year 7-Year 10-Year 15-Year 20-Year Year 1 Year 2 33.33% 20.00% 14.29% 10.00% 5.00% 3.750% 44.45 32.00 24.49 18.00 9.50 7.219 Year 3 14.81 19.20 17.49 14.40 8.55 6.677 Year 4 7.41 11.52 12.49 11.52 7.70 6.177 Year 5 11.52 8.93 9.22 6.93 5.713 Year 6 Year 7 Year 8 5.76 8.92 7.37 6.23 5.285 8.93 6.55 5.90 4.888 4.46 6.55 5.90 4.522 Year 9 6.56 5.91 4.462 Year 10 Year 11 Year 12 6.55 5.90 4.461 3.28 5.91 4.462 5.90 4.461 Year 13 5.91 4.462 Year 14 5.90 4.461 Year 15 5.91 4.462 Year 16 2.95 4.461 TABLE 2a MACRS Mid-Quarter Convention: For proper Depreciation Rate for Recovery Period 5-Year 7-Year Year 1 35.00% 25.00% Year 2 26.00 21.43 Year 3 15.60 15.31 Year 4 11.01 10.93 Year 5 11.01 8.75 Year 6 1.38 8.74 Year 7 8.75 Year 8 1.09 TABLE 2b MACRS Mid-Quarter Convention: For prope Depreciation Rate for Recovery Period 5-Year 7-Year Year 1 25.00% 17.85% Year 2 30.00 23.47 Year 3 18.00 16.76 Year 4 11.37 11.97 Voom 11. 27 O 07 TABLE 2a MACRS Mid-Quarter Convention: For proper Depreciation Rate for Recovery Period 5-Year 7-Year Year 1 35.00% 25.00% Year 2 26.00 21.43 Year 3 15.60 15.31 Year 4 11.01 10.93 Year 5 11.01 8.75 Year 6 1.38 8.74 Year 7 8.75 Year 8 1.09 TABLE 2b MACRS Mid-Quarter Convention: For prope Depreciation Rate for Recovery Period 5-Year 7-Year Year 1 25.00% 17.85% Year 2 30.00 23.47 Year 3 18.00 16.76 Year 4 11.37 11.97 Voom 11. 27 O 07 Table 1 MACRS Half-Year Convention Depreciation Rate for Recovery Period 3-Year 5-Year 7-Year 10-Year 15-Year 20-Year Year 1 Year 2 33.33% 20.00% 14.29% 10.00% 5.00% 3.750% 44.45 32.00 24.49 18.00 9.50 7.219 Year 3 14.81 19.20 17.49 14.40 8.55 6.677 Year 4 7.41 11.52 12.49 11.52 7.70 6.177 Year 5 11.52 8.93 9.22 6.93 5.713 Year 6 Year 7 Year 8 5.76 8.92 7.37 6.23 5.285 8.93 6.55 5.90 4.888 4.46 6.55 5.90 4.522 Year 9 6.56 5.91 4.462 Year 10 Year 11 Year 12 6.55 5.90 4.461 3.28 5.91 4.462 5.90 4.461 Year 13 5.91 4.462 Year 14 5.90 4.461 Year 15 5.91 4.462 Year 16 2.95 4.461 TABLE 2a MACRS Mid-Quarter Convention: For proper Depreciation Rate for Recovery Period 5-Year 7-Year Year 1 35.00% 25.00% Year 2 26.00 21.43 Year 3 15.60 15.31 Year 4 11.01 10.93 Year 5 11.01 8.75 Year 6 1.38 8.74 Year 7 8.75 Year 8 1.09 TABLE 2b MACRS Mid-Quarter Convention: For prope Depreciation Rate for Recovery Period 5-Year 7-Year Year 1 25.00% 17.85% Year 2 30.00 23.47 Year 3 18.00 16.76 Year 4 11.37 11.97 Voom 11. 27 O 07
Expert Answer:

Related Book For 

Introduction to Management Accounting
ISBN: 978-0133058789
16th edition
Authors: Charles Horngren, Gary Sundem, Jeff Schatzberg, Dave Burgsta
Posted Date:
Students also viewed these accounting questions
-
a. Make an exponential smoothing forecast for periods 2 through 5 with 2 values of alpha, 0.05 and 0.60, and an assumed forecast for period 1 of 30. b. Compute the MAD for each of the above...
-
4 cubed + 10 X 20 + 8 squared 23
-
Below is a partial balance sheet of WOU Berhad The company declared a 2 for 1 stock split. i) Calculate the new par value. ii) Calculate the new numbers of share outstanding. Common stock (RM 2)...
-
Describe and sketch the surface. 16x + 16y -9z = 0
-
Estimate the mass of your head. Assume that its density is that of water, 1000 kg/m3.
-
What is the difference between powered lead through and manual lead through in robot programming?
-
Describe situations in which an organization should buy rather than build software components.
-
A contractor is considering whether to purchase or lease a new machine for his layout site work. Purchasing a new machine will cost $12,000 with a salvage value of $1200 at the end of the machine's...
-
In a dealer market, the ask price is the highest price the dealer offered to buy a security and the bid price is the lowest price the dealer offered to sell a security. The difference of the ask...
-
You have just been offered a full-time position in Cambridge and want to live close to where you will be working.The picture shows a condo currently listed for sale at $575,000 in Cambridge.It last...
-
One management strategy for reducing Foreign Exchange Rate risk is to employ Futures Contracts and Forward Contracts. Explain when each strategy is most appropriate. Be sure to include examples to...
-
JanehasaskedyoutomakechangestotheCompanySettingstoset upanduseadditionalQuickBooksfeatures. Jane knows that discountsare a part of the business. She asks you to make sure that when you add...
-
a) Discuss whether the system should be controllable or not. Check your intuition by forming the controllability matrix and checking its rank. b) Assume that all of the state variables can be...
-
(2) The data below is given as input values for a water-flood in a horizontal, linear reservoir. Relative permeability data in this reservoir are given as: kr = krw.max kyo = Kyo,max Fluid and...
-
Ashby plot for materials index of (E2/p), suitable for a Beam of minimum weight and prescribed stiffness. On the Log E versus Log p graph, slide the materials index line of slope 2 upwards to...
-
Use the energy method to determine the equations of motion and the natural frequencies of the systems shown in the following figures: k www 30 111 m
-
The kitchen textiles buyer placed an order for 12,000 holiday motif towels at a billed cost of $1.70 each. The shipping charges on the order amounted to $300. The buyer negotiated a cost discount of...
-
What exactly is a prima facie duty? How does an ethic of prima facie duties differ from monistic and absolutist ethical theories?
-
Green Lighting Supply plans inventory levels (at cost) at the end of each month as follows: May, $271,000; June, $226,000; July, $209,000; and August, $241,000. Sales are expected to be June,...
-
Kagawa Manufacturing Company budgeted its 20X0 variable overhead at 13,800,000 and its fixed overhead at 24,192,000. Expected 20X0 volume was 5,600 units. Actual costs for production of 5,700 units...
-
Some companies are run by engineers and other technical specialists. For example, a manager in a division that is now part of ArvinMeritor, an automotive parts supplier, once said that thered be...
-
For the HiTech example (17.1), find the risk-neutral probability of default. Example 17.1 (A leveraged firm) The HiTech firm currently has a value of $1 mil- lion and is financed in part by a 5-year...
-
Suppose that the adjustable-rate auto loan of Example 16.5 is modified by the provision of CAP that guarantees the borrower that the interest rate to be applied will never exceed \(11 \%\). What is...
-
Explain how you would find the value of a bond futures option.

Study smarter with the SolutionInn App