

Question: DATA Relative Frequency Histogram I Construct a SET relative frequency histogram for these DS0115 50 measurements using classes starting at $1.6$ with a class width
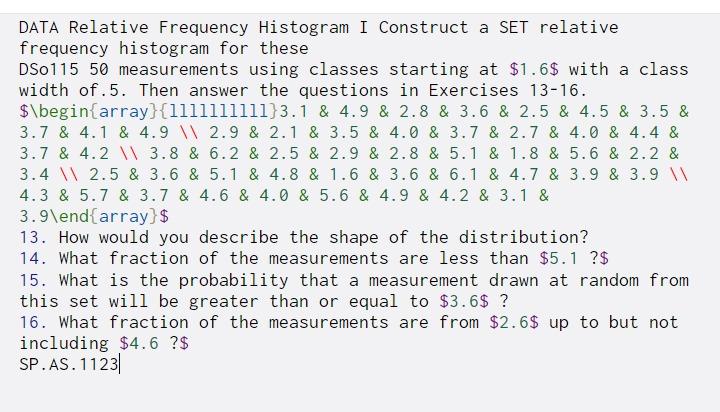
DATA Relative Frequency Histogram I Construct a SET relative frequency histogram for these DS0115 50 measurements using classes starting at $1.6$ with a class width of.5. Then answer the questions in Exercises 13-16. $\begin{array}{llllllllll}3.1 & 4.9 & 2.8 & 3.6 & 2.5 & 4.5 & 3.5 & 3.7 & 4.1 & 4.9 2.9 & 2.1 & 3.5 & 4.0 & 3.7 & 2.7 & 4.0 & 4.4 & 3.7 & 4.2 3.8 & 6.2 & 2.5 & 2.9 & 2.8 & 5.1 & 1.8 & 5.6 & 2.2 & 3.4 2.5 & 3.6 & 5.1 & 4.8 & 1.6 & 3.6 & 6.1 & 4.7 & 3.9 & 3.9 4.3 & 5.7 & 3.7 & 4.6 & 4.0 & 5.6 & 4.9 & 4.2 & 3.1 & 3.9\end{array} $ 13. How would you describe the shape of the distribution? 14. What fraction of the measurements are less than $5.1 ?$ 15. What is the probability that a measurement drawn at random from this set will be greater than or equal to $3.6$ ? 16. What fraction of the measurements are from $2.6$ up to but not including $4.6 ?$ SP.AS. 1123
Step by Step Solution
There are 3 Steps involved in it

Get step-by-step solutions from verified subject matter experts