

Question: Data represent 13. A to C The accompanying data represent the weights of various domestic cars and their gas mileages in the city. The linear
Data represent 13. A to C
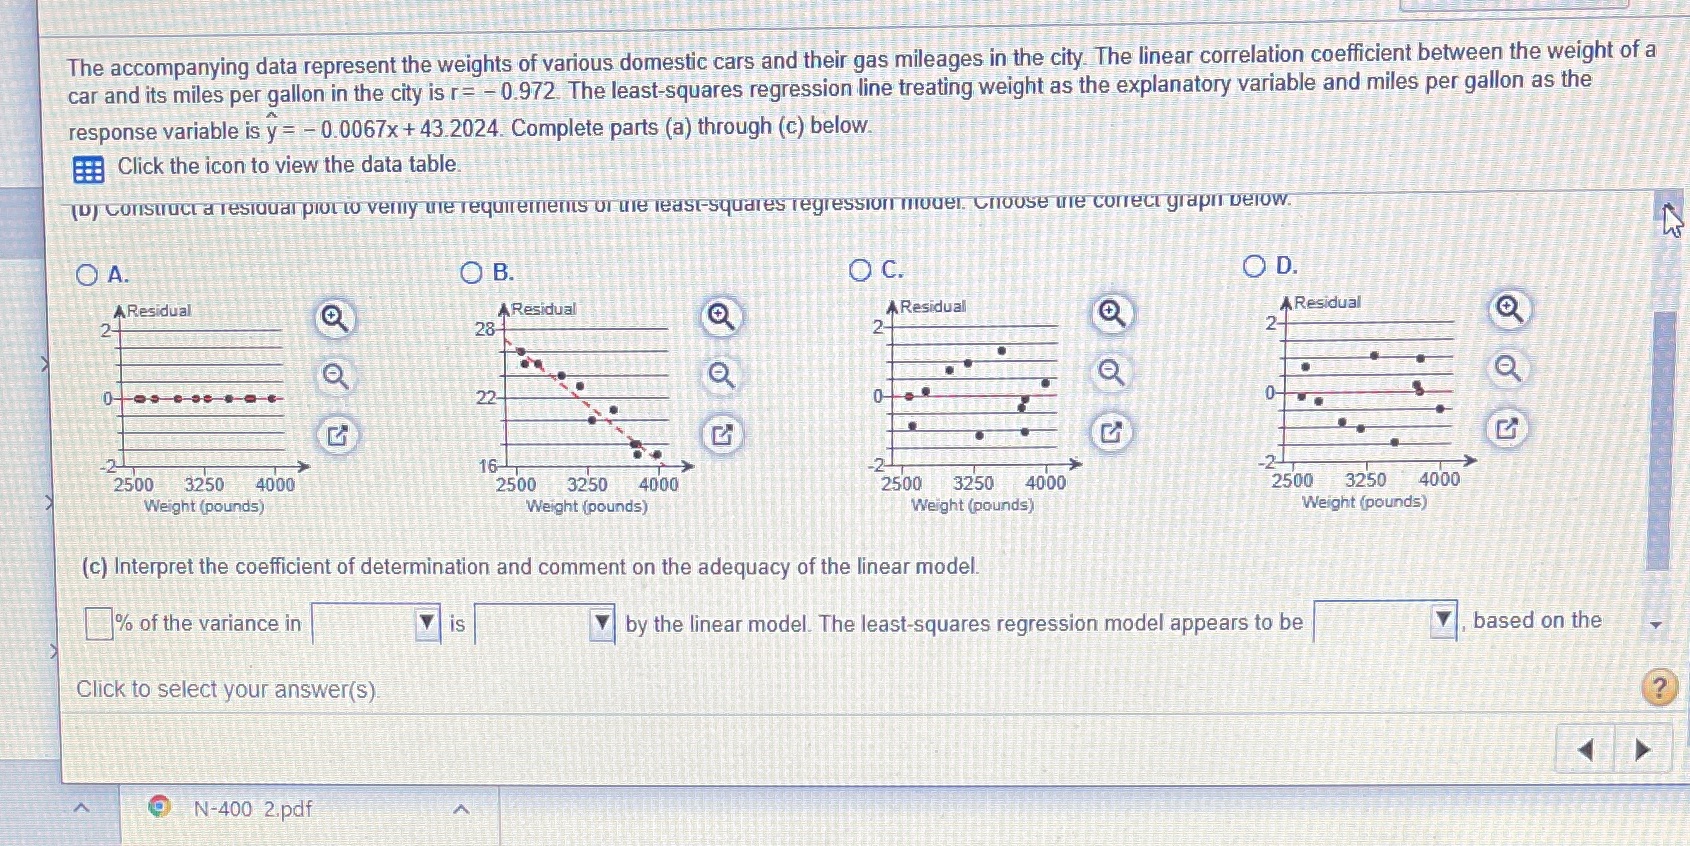
The accompanying data represent the weights of various domestic cars and their gas mileages in the city. The linear correlation coefficient between the weight of a car and its miles per gallon in the city is r= - 0.972. The least-squares regression line treating weight as the explanatory variable and miles per gallon as the response variable is y = - 0.0067x + 43.2024. Complete parts (a) through (c) below. Click the icon to view the data table (o) Construct a residual plot to very Te requirements or the least-squares regression model. Choose are correct graph below. O A. O B. OC. OD. AResidual AResidual AResidual A Residual 28 2- 22 16- 2500 3250 4000 2500 3250 4000 2500 3250 4000 2500 3250 4000 Weight (pounds) Weight (pounds) Weight (pounds) Weight (pounds) (c) Interpret the coefficient of determination and comment on the adequacy of the linear model. % of the variance in by the linear model. The least-squares regression model appears to be based on the Click to select your answer(s) N-400 2.pdf
Step by Step Solution
There are 3 Steps involved in it

Get step-by-step solutions from verified subject matter experts