

Question: data science probability (python) Free Response problemsWrite your answers in the spaces following each prompt i pomible Make note if your work contiene where 12.
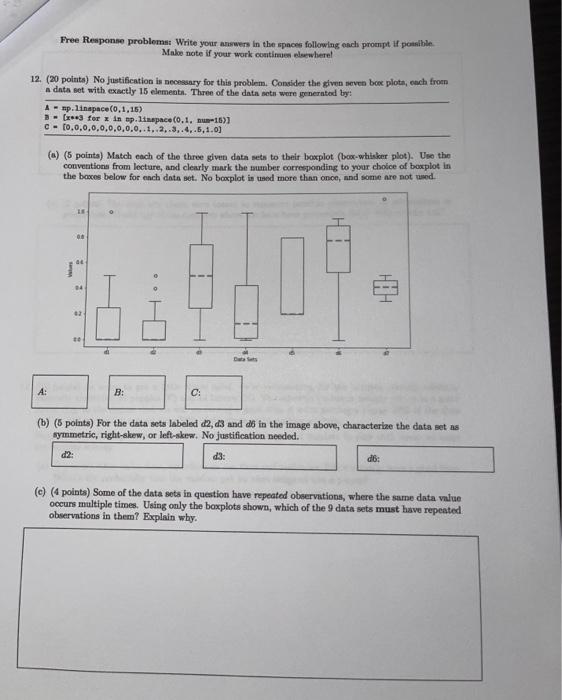
Free Response problemsWrite your answers in the spaces following each prompt i pomible Make note if your work contiene where 12. (20 points) No justification is necesary for this problem. Consider the given nevenboe plota, each from a data set with exactly 15 element. Three of the data sets were generated by A - np. linapace(0,1,16) 1 - (x for x in sp.linspace(0.1.15) C -0,0,0,0,0,0,0,0,0..1..2..3..4..5.1.01 (a) (5 points) Match each of the three given data sets to their boxplot (bow-whisker plot). Use the convention from lecture, and clearly mark the number corresponding to your choice of boxplot in the boxes below for ench data set. No boplot in twed more than once, and some are not und LE 34 A: B: C: (b) (5 points) For the data sets labeled d2, d3 and do in the image above, characterize the data set as symmetric, right-skew, or left-skew. No justification needed. do: (e) (4 points) Some of the data sets in question have repeated observations, where the same data value occurs multiple times. Using only the baxplots shown, which of the 9 data sets must have repeated observations in them? Explain why. (d) (3 points) Is the mean of dl or d2 likely to be higher? Explain. (e) (3 points) The data sets above were meant to represent possible observations of probabilities or proportions. Could any of the data sets above not have been proportion data? Why or why not
Step by Step Solution
There are 3 Steps involved in it

Get step-by-step solutions from verified subject matter experts